Download
1 / 22
220 likes | 341 Views
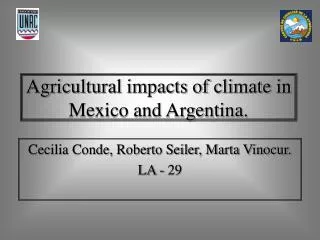
Climate variability, trends and scenarios for Mexico and Argentina. Cecilia Conde, Marta Vinocur, Carlos Gay, Roberto Seiler. AIACC LA-29. Integrated Assessment of Social Vulnerability and Adaptation to Climate Variability and Change Among Farmers in Mexico and Argentina.

E N D
Climate variability, trends and scenarios for Mexico and Argentina. Cecilia Conde, Marta Vinocur, Carlos Gay, Roberto Seiler. AIACC LA-29 Integrated Assessment of Social Vulnerability and Adaptation to Climate Variability and Change Among Farmers in Mexico and Argentina
Uribe, 2002. Douglas, 1993. Douglas, 1993. Palma, 2004
Central Region Veracruz 1 event > +1 std 12 Events > +1 std 8 events <-1std 3 events <-1std 1 event > +1 std 7 events > +1 std 7 events<-1std 6 events<-1std
Córdoba Province Argentina Study area
IPCC vs Observed data (3 stations)Southern Córdoba Pcp. Obs. DEF. r = 0.86
Some advantages of these Climatic Risk Spaces • Relation between climate – specific crops • Allows us to differentiate seasonal climatic impacts from other stressors • Relation to current governmental programs (example: FAPRACC, Mexico). • Helps communication. Decision makers and regional experts. • Helps to decide between climate change scenarios.
Uncertainties • Spatial: Regional, local? • Temporal: annual, seasonal, monthly, daily data (frost, hail, strong winds)? Future? • “Risk” to whom? to what? Different crop sensitivity
Climate Change scenarios • Magicc /Scengenoutputs • SRES: A2 and B2 • Medium and High Sensitivity • Echam, Hadley, GFDL • 2020, 2050 (monthly and seasonal) • Temperature and Precipitation • Simple interpolation in 1ºx1º grid (Mexico). • For study sites: scatter plots (simple interpolation) • Downscaling techniques for Veracruz (Mexico). No SRES. 2xCO2 C. Conde, A. Tejeda, C. Gay, O. Sánchez*, R. Araujo, B. Palma, Vinocur.
Selected GCMs • ECHAM model: Lowest differences with observed data. México (Magaña, 2003;Conde, 2003). • GFDL (and CC) models: used in Country Study: Mexico(1994 – 1996) • HADLEY model: used in LA • These models are used also for Córdoba, Argentina, as suggested by LA-26
Downscaling. JJA. GFDL Temperature Base Scenario • T = F(Z). (Used for electricity rates) • T0corr=- k1 – k2 Z + k3 T1Model • r = 0.966; r2=93.4 • Tcorr = b1T Palma, B. 2004
Examples for Mexico. (12%,- 8%) (16%, 8%) (-8,-2) Sánchez, Araujo, Conde “user friendly” ECHAM98. A2 MES. 2020. PRECIPITATION. JULY
MEXICO. Temperature Climate Change Scenarios. A2, B2. 2020, 2050. 3 GCMs. July
ARGENTINA. Temperature Climate Change Scenarios. A2, B2. 2020, 2050. 3 GCMs. Jan.
MEXICO. Precipitation Climate Change Scenarios. A2, B2. 2020, 2050. 3 GCMs. July
Argentina. Precipitation Climate Change Scenarios.A2, B2. 2020, 2050. 3 GCMs. Jan.
Decisions? Which of the multiple combinations represent future climatic risk? Or an opportunity? Pcp: -35% to +40% T: 1.5ºC to 3.8ºC
What about changes in variability? Summer Temperature 1969-2050 E=Echam, H=Hadley, sm=Clim Sen. Med., sa=Clim. Sen. High, trend=tendency (aleatory numeric generator). Gay,C., F. Estrada, C. Conde, 2004
Conclusions • Regional climatic variability and trends analysis helps defining climatic risk • Climatic “risk spaces” can be use as a tool to communicate risk, related to crops and defining other stressors. • Regional climate change scenarios can be compared to “risk spaces” to define future climatic risk and/or opportunities. • Changes in climate variability are fundamental for agriculture