Download
1 / 31
320 likes | 354 Views
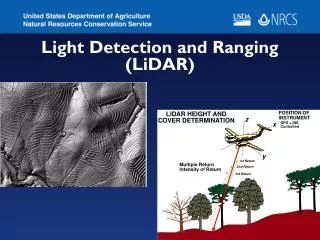
RADAR. RAdio Detection And Ranging. World War II. Was originally for military use Sent out electromagnetic radiation (Active) Bounced off an object and returned to a listening device Timed the time it takes for the energy to travel to the target and back ( echo )

E N D
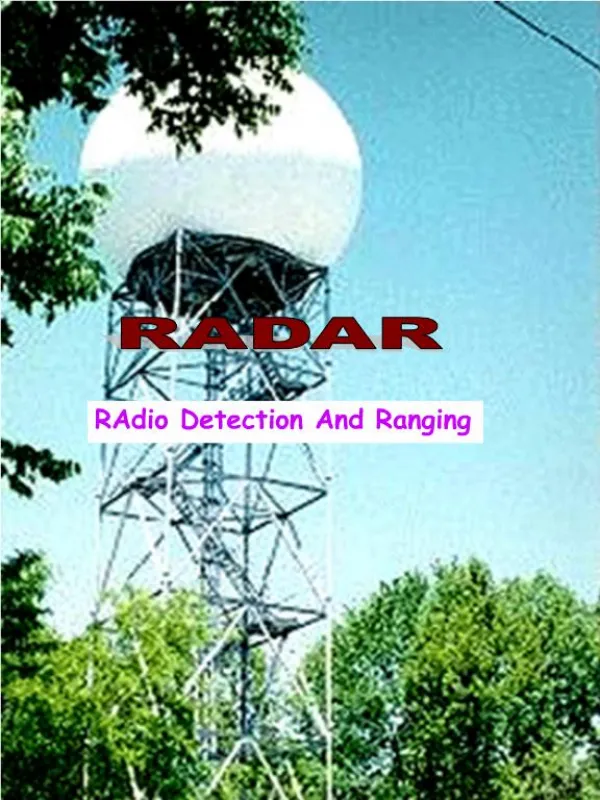
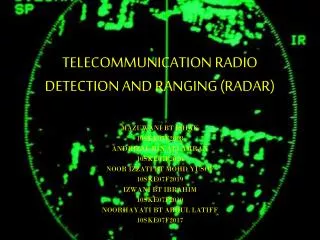
RADAR RAdio Detection And Ranging
World War II • Was originally for military use • Sent out electromagnetic radiation (Active) • Bounced off an object and returned to a listening device • Timed the time it takes for the energy to travel to the target and back (echo) • Estimated a location of that object • Incidentally found the detection of clouds.
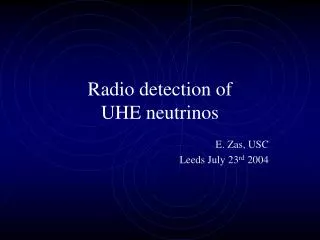
Signal scatted by small particles Signal scatted by large particles Reflectivity Forward signal
Application in Meteorology • Raindrops made excellent targets for S-Band radar (wavelength ~10cm), no raindrops, no data!!! • Weather radar units were set up across the United States in the mid 1960's (WSR-57, reflectivity only ). No data Courtesy of COMET
Radar L band radars : 15-30 cm, 1-2 GHz Clear air turbulence studies. S band radars : 8-15 cm, 2-4 GHz Not easily attenuated (far range) Large antenna dish C band radars : 4-8 cm, 4-8 GHz Easily attenuated (short range) Small antenna dish X band radars : 2.5-4 cm, 8-12 GHz Easier attenuated (shorter range) detect smaller particles
Radar The higher the frequency, the higher the resolution The higher the frequency, the stronger the attenuation (shorter range) The larger the antenna dish, the higher the resolution
Resolutions • Provide good observations for small scale phenomena, (e.g., thunderstorms, hurricane eyewall)
Radar Measurements Reflectivity (WSR-57) Radial velocity (Doppler radar) Refractivity (detect moisture boundary – help forecasting) Particle identification (ID) (solid or liquid; graupel, snow, etc. dual polarized)
Reflectivity VPR (Vertical profile of reflectivity (Bright band) Melting level (bright band) Melting level (bright band)
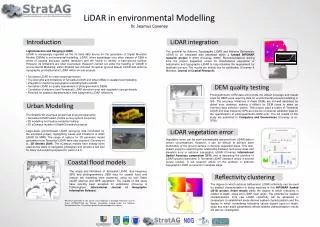
NEXRAD • Next Generation WeatherRadar • WSR – 88D • Weather Surveillance Radar 88 Doppler • Originally deployed in Oklahoma City in 1988. http://www.letxa.com/nexradintro.php • S Band (wavelength ~ 10 cm) • Reflectivity + radial velocity • Identify the conditions which lead to severe weather such as tornados • About 230 km detecting range • Scan time, very 6 min, but reported hourly • Below 1 km, 72% missed
NEXRAD 158 radars
CASA • Collaborative Adaptive Sensing of the Atmosphere • X Band (wavelength ~ 2.5 – 4 cm) • Low power • Higher resolution • Small disk • Shorter range • Phased array radar, reduce scan time, every min (more leading time) • Enable to collect data below 3 km
CASA Scan quicker and to lower level
Mobil Radar TEAM-R (Courtesy of Prof Liou) • X band, wave length = 3 cm • Detecting distance ~ 40 km
Elevation angle (About 0.5 – 19.5 degree)
Plan Position Indicator (PPI) • Elevation angle = constant • Varies azimuth angle • Return is mapped on a horizontal plane • Scan 360o, surveillance scan • Scan < 360o, sector scan
Plan Position Indicator (PPI) Top view Elevation angle
Plan Position Indicator (PPI) Direction Speed Image Wind bars Blue – In Red – Out
Mesocyclones Where is the location of the radar?
Cumulonimbus Clouds Supercell In general, radar images won’t be able to see tornados (unless very close), but can see the favorable environment for tornado development
F4 Tornado, hook echo May 8, 2003, Oklahoma City Strong updraft
Tennessee and Kentucky May 18, 1995
Texas, hook echo May 29, 1995 A tornado watch: issued by the National Weather Service when conditions are favorable for the development of tornadoes in and close to the watch area. A tornado warning: issued by the National Weather Service when a tornado is sighted by spotters or indicated on radar and is occurring or imminent in the warning area.
NEXRAD (non-polarimetric) Radar Polarimetric Radar http://www.nssl.noaa.gov/dualpol/
Differential Reflectivity– The differential reflectivity is a ratio of the reflected horizontal and vertical power returns. Among other things, it is a good indicator of drop shape (e.g., round like snowflakes or hailstones, or if they are somewhat flat like raindrops). In turn the shape is a good estimate of average drop size. • Correlation Coefficient – A statistical correlation between the reflected horizontal and vertical power returns. It is a good indicator of regions where there is a mixture of precipitation types, such as rain and snow. • Linear Depolarization Ratio – This is a ratio of a vertical power return from a horizontal pulse or a horizontal power return from a vertical pulse. It, too, is a good indicator of regions where mixtures of precipitation types occur. http://www.nssl.noaa.gov/dualpol/
S-POL http://www.eol.ucar.edu/rsf/spol/spol.html • Developed at NCAR/EOL, usually used for field projects. • S-band, dual polarized • Reflectivity, radial velocity, and particle ID http://www.radar.mcgill.ca/define_dual_pol.html
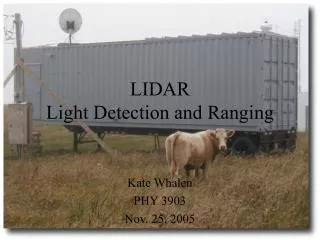
Vr1 z Vr3 Vr2 w v y x u Wind Profiler Similar to Radar