Download

1 / 85
870 likes | 944 Views
An Introduction to the 12 lead ECG. Dr AJ Barnard. By the end of this lecture, you will be able to: Understand the 12 lead ECG in relation to the coronary circulation and myocardium Perform an ECG recording Identify the ECG changes that occur in the presence of an acute coronary syndrome.

E N D
An Introduction to the12 lead ECG Dr AJ Barnard
By the end of this lecture, you will be able to: Understand the 12 lead ECG in relation to the coronary circulation and myocardium Perform an ECG recording Identify the ECG changes that occur in the presence of an acute coronary syndrome. Begin to recognise and diagnose an acute MI. 12 Lead ECG Interpretation
What is a 12 lead ECG? • Records the electrical activity of the heart (depolarisation and repolarisation of the myocardium) • Views the surfaces of the left ventricle from 12 different angles
Why do a 12 lead ECG? • Monitor patients heart rate and rhythm • Evaluate the effects of disease or injury on heart function • Detect presence of ischaemia / damage • Evaluate response to medications, e.g anti dysrhythmics • Obtain baseline recordings before during and after surgical procedures
Recording an ECG Explain procedure to patient, obtain consent and check for allergies Check cables are connected Ensure surface is clean and dry Ensure electrodes are in good contact with skin Enter patient data Wait until the tracing is free from artifact Request that patient lies still. Push button to start tracing
Procedure (cont.) Before disconecting the leads ensure the recording is - Free from artifact Paper speed is 25mm/sec Normal standardisation of 1mv, 10mm Lead placement is correct ECG is labelled correctly
Anatomy and Physiology Review • A good basic knowledge of the heart and cardiac function is essential in order to understand the 12 lead ECG • Anatomical position of the heart • Coronary Artery Circulation • Conduction System
Anatomical Position of the Heart • Lies in the mediastinum behind the sternum • between the lungs, just above the diaphragm • the apex (tip of the left ventricle) lies at the fifth intercostal space, mid-clavicular line
Right Coronary Artery right atrium right ventricle inferior wall of left ventricle posterior wall of left ventricle 1/3 interventricular septum Coronary Artery Circulation
Left Anterior Descending Artery antero-lateral surface of left ventricle 2/3 interventricular septum Circumflex Artery left atrium lateral surface of left ventricle Coronary Artery CirculationLeft Main Stem Artery divides in two:
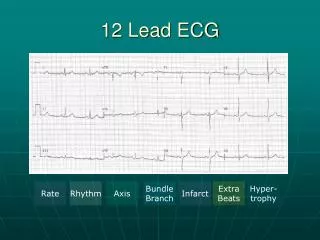
The standard 12 Lead ECG 6 Limb Leads 6 Chest Leads (Precordial leads) avR, avL, avF, I, II, III V1, V2, V3, V4, V5 and V6 Rhythm Strip
Limb Leads 3 Unipolar leads • avR - right arm (+) • avL - left arm (+) • avF - left foot (+) • note that right foot is a ground lead
3 Bipolar Leads form (Einthovens Triangle) Lead I - measures electrical potential between right arm (-) and left arm (+) Lead II - measures electrical potential between right arm (-) and left leg (+) Lead III- measures electrical potential between left arm (-) and left leg (+) Limb Leads
Chest Leads 6 Unipolar leads Also known as precordial leads V1, V2, V3, V4, V5 and V6 - all positive
Think of the positive electrode as an ‘eye’… the position of the positive electrode on the body determines the area of the heart ‘seen’ by that lead.
Surfaces of the Left Ventricle • Inferior - underneath • Anterior - front • Lateral - left side • Posterior - back
Inferior Surface • Leads II, III and avF look UP from below to the inferior surface of the left ventricle • Mostly perfused by the Right Coronary Artery
Inferior Leads • II • III • aVF
Anterior Surface • The front of the heart viewing the left ventricle and the septum • Leads V2, V3 and V4 look towards this surface • Mostly fed by the Left Anterior Descending branch of the Left artery
Anterior Leads • V2 • V3 • V4
Lateral Surface • The left sided wall of the left ventricle • Leads V5 and V6, I and avL look at this surface • Mostly fed by the Circumflexbranch of the left artery
Posterior Surface • Posterior wall infarcts are rare • Posterior diagnoses can be made by looking at the anterior leads as a mirror image. Normally there are inferior ischaemic changes • Blood supply predominantly from the Right Coronary Artery
RIGHT LEFT Antero-Septal V1,V2, V3,V4 Inferior II, III, AVF Lateral I, AVL, V5, V6 Posterior V1, V2, V3
ECG Waveforms • Normal cardiac axis is downward and to the left • ie the wave of depolarisation travels from the right atria towards the left ventricle • when an electrical impulse travels towards a positive electrode, there will be a positive deflection on the ECG • if the impulse travels away from the positive electrode, a negativedeflection will be seen
ECG Waveforms • Look at your 12 lead ECG’s • What do you notice about lead avR? • How does this compare with lead V6?
Basic electrocardiography • Heart beat originates in the SA node • Impulse spreads to all parts of the atria via internodal pathways • ATRIAL contraction occurs • Impulse reaches the AV node where it is delayed by 0.1second • Impulse is conducted rapidly down the Bundle of His and Purkinje Fibres • VENTRICULAR contraction occurs
The P wave represents atrial depolarisation • the PR interval is the time from onset of atrial activation to onset of ventricular activation • The QRS complex represents ventricular depolarisation • The S-T segment should be iso-electric, representing the ventricles before repolarisation • The T-wave represents ventricular repolarisation • The QT interval is the duration of ventricular activation and recovery.
ECG Abnormalities Associated with ischaemia
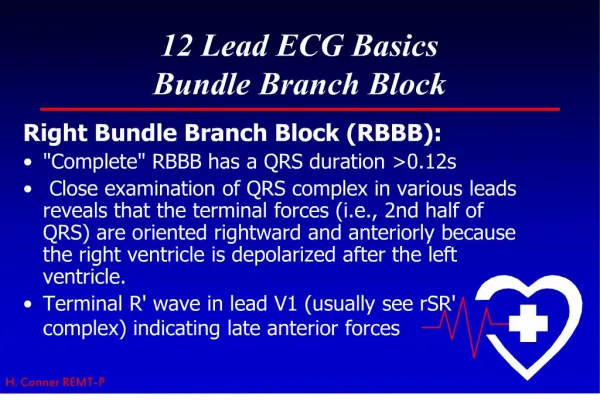
Ischaemic Changes • S-T segment elevation • S-T segment depression • Hyper-acute T-waves • T-wave inversion • Pathological Q-waves • Left bundle branch block
ST Segment • The ST segment represents period between ventricular depolarisation and repolarisation. • The ventricles are unable to receive any further stimulation • The ST segment normally lies on the isoelectric line.
ST Segment Elevation The ST segment lies above the isoelectric line: • Represents myocardial injury • It is the hallmark of Myocardial Infarction • The injured myocardium is slow to repolarise and remains more positively charged than the surrounding areas • Other causes to be ruled out include pericarditis and ventricular aneurysm
Myocardial Infarction • A medical emergency!!! • ST segment curves upwards in the leads looking at the threatened myocardium. • Presents within a few hours of the infarct. • Reciprocal ST depression may be present
ST Segment Depression Can be characterised as:- • Downsloping • Upsloping • Horizontal
Horizontal ST Segment Depression Myocardial Ischaemia: • Stable angina - occurs on exertion, resolves with rest and/or GTN • Unstable angina - can develop during rest. • Non ST elevation MI - usually quite deep, can be associated with deep T wave inversion. • Reciprocal horizontal depression can occur during AMI.
ST Segment Depression Downsloping ST segment depression:- • Can be caused by digoxin. Upward sloping ST segment depression:- • Normal during exercise.
T waves • The T wave represents ventricular repolarisation • Should be in the same direction as and smaller than the QRS complex • Hyperacute T waves occur with S-T segment elevation in acute MI • T wave inversion occurs during ischaemia and shortly after an MI
T waves Other causes of T wave inversion include: • Normal in some leads • Cardiomyopathy • Pericarditis • Bundle Branch Block (BBB) • Sub-arachnoid haemorrhage • Peaked T waves indicate hyperkalaemia