Download
1 / 29
290 likes | 429 Views
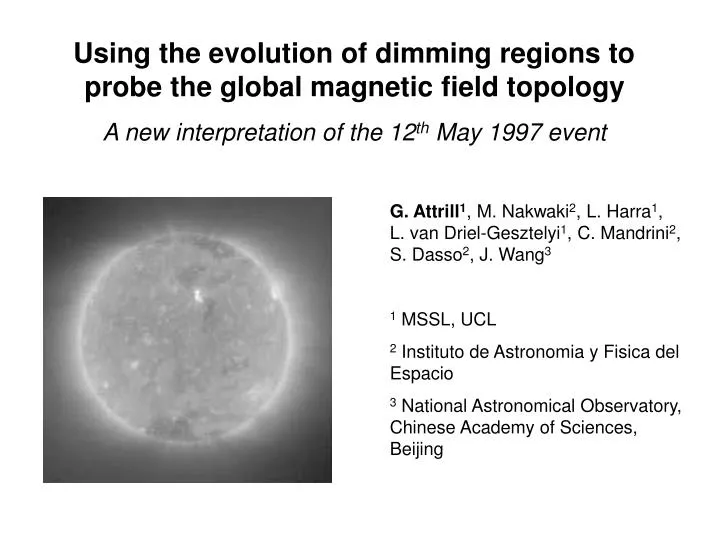
Using the evolution of dimming regions to probe the global magnetic field topology A new interpretation of the 12 th May 1997 event. G. Attrill 1 , M. Nakwaki 2 , L. Harra 1 , L. van Driel-Gesztelyi 1 , C. Mandrini 2 , S. Dasso 2 , J. Wang 3 1 MSSL, UCL

E N D
Using the evolution of dimming regions to probe the global magnetic field topology A new interpretation of the 12th May 1997 event G. Attrill1, M. Nakwaki2, L. Harra1, L. van Driel-Gesztelyi1, C. Mandrini2, S. Dasso2, J. Wang3 1 MSSL, UCL 2 Instituto de Astronomia y Fisica del Espacio 3 National Astronomical Observatory, Chinese Academy of Sciences, Beijing
Coronal Dimming Regions • Dimming seen as a decrease in intensity in both EUV and X-ray images. • Dimmings appear relatively suddenly (10s minutes) • Good correlation with CME events • 1st observation by Skylab mission (1973-74): “Transient Coronal Holes” (Rust, 1983) • POSSIBLE CAUSES: • Density depletion due to an evacuation of plasma • Temperature variation
Link with CMEs • “Double Dimmings” – footpoints of erupted magnetic flux rope? • Mass studies • Dimming typically observed 30 minutes before CME seen in LASCO Motivation: Given the close relationship between coronal dimming regions and CMEs; drive to understand magnetic nature of CMEs naturally requires the magnetic nature of coronal dimming regions…..
This Study • Analyse intensity of coronal dimming regions using 195 A data from SOHO/EIT. • Measure magnetic flux in dimming regions using SOHO/MDI data. • Compare to magnetic flux in the associated magnetic cloud. • Probe magnetic character of coronal dimming regions • Asymmetrical temporal evolution of two main dimmings • “Unidentical Twins”! • Extend overview using Yohkoh soft x-ray data. • Present a model to explain the observational measurements • Indirect calculation of the magnetic reconnection rate • Demonstrate that study of the evolving magnetic nature of coronal dimming regions can be used to probe the large-scale magnetic structure involved in the eruption of a CME
Event of 12th May 1997 • Simple magnetic structure • AR 8038 • LDE flare GOES class C 1.3 • Strong coronal wave signature • Brightening along (& shrinkage of) north polar coronal hole boundary • Filament eruption • Full Halo CME • Associated magnetic cloud reaches Earth 15th May 1997
Pre-eruption EIT on 11th May 1997 Magnetogram Northern end of sigmoidal structure embedded in negative polarity Southern end embedded in positive polarity
Base difference images 05:41 – 00:12 UT Maximum extent of the dimming 05:07 - 00:12 UT Bright coronal wave front
Defining the boundary of the dimming regions A transientcoronal hole is defined as a region where there is an intensity decreasefrom a “normal” intensity to a region with an intensity close to that ofa coronal hole, so we set our contours to lie halfway between the intensityof an area of quiet Sun and the intensity of an existing coronal hole. Potential source of error is selected base difference image: Base difference images showing the main dimming regions. The left panel shows the base difference image (05:41 UT - 00:12 UT). The centre panel shows thebase difference image (05:41 UT - 03:59 UT).
Selected Regions Base difference image (05:41 UT - 00:12 UT) at the maximum extentof the dimming, showing the regions selected for analysis defined by our contourboundary method. Temporal intensity evolution of the dimming regions Temporal variation in EUV intensity(counts/pixel) - a tool that allows us to visualise the physical restructuring of themagnetic field topology.
Evolving dimming regions • The boundaries of transient coronal holesare constantly evolving • Overlaid our contours from images at successive intervalsthroughout our dataset Asymmetric temporal evolution of the unidentical twin dimmings Slow Contraction Fast expansion
Evolution of the area of the two main dimming regions. The dashed line shows the change in area of region 1 and the solid line shows the change in area of region 2. The graph clearly shows the rapid expansion of the dimming regions and the gradual recovery. Region 1 (the northern-most dimming region) starts to recoverbefore dimming region 2, the (southern-most dimming region).
Time of maximum dimming Region 1 (northern dimming) Region 2 (southern dimming)
Intensity line profiles • A change in the average intensity of a dimming region can be caused • by two things: • An actual change in the intensity of the region • A change in the size of the region • Change in intensity of each pixel with respectto its location (rather than the averaged intensity)
Change inintensity WITHIN the dimming regions is clearly visible. Increase in intensity is partlydue to the contraction of the dimming region boundary, but there isalso a contribution from some internal mechanism. Likely candidate is the reconnection relatedprocess of chromospheric evaporation.
Measuring the magnetic flux within the dimmingregions • MDI significantly underestimatesthe magnetic flux. • Following the workof Green et al. (2003), we used the correction factors: • Method described in Mandrini et al.(2005) – filtering quiet sun flux for noise MDI full-disk image at 06:28 UT on 12 May 1997. The colour whiteindicates regions of positive polarity and black indicates regions of negative polarity.
The net flux is the sum of the magnitude of the positive and themagnitude of the negative fluxes The “open” flux is the difference between the flux ofthe two polarities Magnetic flux within each dimming regionat themaximum extent of the dimming Since the majority of small-scale mixed polarities close in their direct vicinity, calculating the “open” flux provides anestimate of how much magnetic flux is potentially free for connectionwith magnetic flux outside of the selected region.
Our measurement of the open flux through region 1 is inagreement with that measured by Webb et al. (2000) for this event,but our measurement through region 2 is double their result. (Theyfound the flux for region 1 to be -9 x10²⁰ Mx and region 2 to be 1.2x10²¹ Mx). From these measurements, a “total linked flux” of 1.0 ± 0.2 x10²¹ Mx is estimated by Webb et al. (2000). If the interpretation of Webb et al. (2000), is correct, so that the main dimming regions (1 and 2) do indeed mark the footpoints of the magnetic flux rope that erupts as the core of the CME, ourcalculation of the total net flux should be halved to account for the factthat we are measuring the flux through both footpoints, and so effectivelymeasuring the flux twice. This yields a net flux of 2.02 x10²¹ Mxand is substantially larger than the “total linked flux” 1.0 ± 0.2 x10²¹ Mx result of Webbet al. (2000).
Evolution of the quiet Sun magnetic flux in the 2 main regions from 04:50 UT to14:59 UT defined by the evolving contours • Only the magnetic fluxmeasurements for the quiet Sun component of the regions are shown. • The active region component has been removed due to its uncertainty. • Region 1 shows an increase in flux, peaking at 05:41 UT and thena gradual decrease. • Region 2 shows an increase, peaking at the sametime, before a slight decrease is indicated. • Region 2 does notimmediately decrease sharply after its maximum (as does region 1),but rather remains at a plateau.
Building a detailed picture of the global nature of the event 2D intensity profile made along the thick white line shown in the leftpanel of this Figure. The centre panel shows the intensity change along the selectedline profile with time. The right panel is a contour plot of the intensity profile. Theshinking of the north polar coronal hole and the brightening along the shrinking boundary is clearly visible.
Calculation of the magnetic fluxcontained in the 15th May 1997magnetic cloud Total axial magnetic flux = 4.8 ± 0.8 x10²⁰ Mx Total azimuthal magnetic flux = 1.3 ± 0.6 x10²¹ Mx (assuming a 1 AU length) The total magnetic flux contained within the cloudis calculated at 1.8 ± 0.7 x10²¹Mx (assuming a 1 AU length). c.f. Estimate by Webb et al. (2000): Axial magnetic flux = 7.35 x10²⁰ Mx
Magnetic topology scenario Using our analysis of the magnetic character and evolution of the dimmings,we propose a scenario which links the formation of the CMEwith the formation of the coronal dimming regions (TCHs). • Webb et al. (2000) propose that the two maindimming regions of 12 May 1997 mark the footpoints of theflux rope that erupts to form the CME. • Kahler & Hudson (2001) state that the formation and expansionof TCHs occurs by the opening of closed magnetic field and that thecontraction must be at least partially due to magnetic reconnection.Interestingly, they suggest that larger-scale newly opened magnetic fielddoes not re-close in the arcade or even in the vicinity of the neutralline, but with an independent source of open magnetic field of oppositepolarity. They propose that such a magnetic field could be found in • previously existing coronal holes. Applying these ideas to our event suggests the following scenariowith respect to the evolution of the global magnetic field topology….
North Polar Coronal Hole Region 2 Region 1 Magnetic topology scenario Dashed lines represent the pre-event magnetic structureand the solid lines the post-event magnetic structure. The hashed regions representthe main dimming regions.
Implications of our scenario Interaction with the north polar coronalhole magnetic field effectively closes dimming region 1 (the northernmost dimming region). Thus dimming region 2 (the southenmost dimmingregion) that remains “open”, becomes the main source regionof the developing magnetic cloud at the (solar) Western leg of theexpanding CME. • The total open flux from dimming region 2 is measured as 2.12 x10²¹Mx. • The total magnetic flux contained within the cloudis calculated as 1.8 ± 0.7 x10²¹Mx (assuming a 1 AU length). • Therefore the magnetic flux contained in the magneticcloud measured at Earth on 15 May 1997 comes mainly from dimmingregion 2, the southern-most, long-lived, positive polarity dimmingregion. The absence of bi-directional electron streams in this magnetic cloudis noted by Webb et al. (2000). In view of our new interpretation ofthis event, we suggest that this absenceis most likely due to the source of the magnetic cloud coming onlyfrom the southern-most dimming region (one footpoint of the eruptedflux rope), rather than jurisdiction for a questionable correspondence between bi-directional electron flows and such solar ejecta.
Rotation of the Filament Partial Filament Eruption N-S alignment E-W alignment Webb et al. (2000) COUNTER CLOCK-WISE ROTATION
Entire structure of CME from core to “skirt” exhibits writhe as it erupts. Rotation of Coronal “Wave” signature Podladchikova & Berghmans (2005) COUNTER CLOCK-WISE ROTATION
N-S alignment changes to E-W alignment Webb et al. (2000) 0 degree pitch angle electrons. Electrons travel parallel to B from the (solar) West Flux rope S
Electrons travel parallel to B from the (solar) West. Ie. West leg is connected to the Sun, East leg is disconnected. Given the CCW rotation, solar WEST maps back to the Sun as SOUTH. Ie. South leg is connected.
Indirect calculation of the magnetic reconnectionrate Assuming the validity of our proposed model, then the contraction ofthe negative polarity outer boundary of region 1 (O1) occurs directlyas a result of reconnection with the positive open magnetic field of thenorth polar coronal hole (OCH). The rate of contraction for the northpolar coronal hole boundary is measured as 2 kms−1. Conservation of magnetic flux:
The total open flux from dimming region 2 is measured as 2.12 x10²¹Mx. The total magnetic flux contained within the cloudis calculated as 1.8 ± 0.7 x10²¹Mx (assuming a 1 AU length). This scenario is derivedfrom study of the evolution of the coronal dimming regions.