Download
1 / 9
90 likes | 211 Views
Building Momentum, Doubling Results Tuesday, September 11 th 2007. Philip P. Jalbert Radon Team Leader Indoor Environments Division U.S. Environmental Protection Agency 202.343.9431, jalbert.philip@epa.gov. 1-1. Example of a State Goal. Illinois. 1,160 lives as risk.

E N D
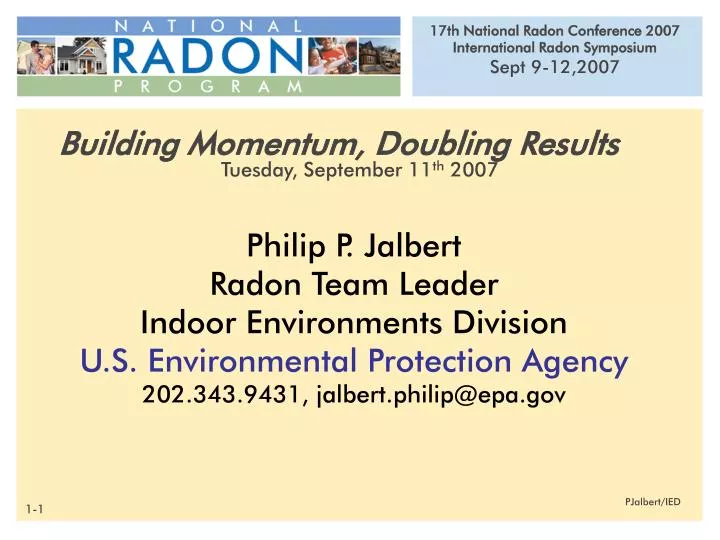
Building Momentum, Doubling Results Tuesday, September 11th 2007 Philip P. Jalbert Radon Team Leader Indoor Environments Division U.S. Environmental Protection Agency202.343.9431, jalbert.philip@epa.gov 1-1
Example of a State Goal Illinois 1,160 lives as risk 1,542 Mitigations : 1 life saved {1,788,720} 5,292 RRNC : 1 life saved {6,138,720} 1-10
Estimate of State Radon-related Lung Cancer Deaths • 21,385 • {National EPA State Risk Estimates, 2007, Draft} • 21,100 • {National EPA Risk Assessment, 2003} • Factors/data needed for the calculation: • (1) Estimated average radon level for Zone 1, 2 & 3 • (2) Estimated average radon level for each State • {QA’d comparing LBNL High Radon Project to EPA NRRS} • (3) State Lung Cancer Death Rates {U.S. - Radon 13.5%} • (4) Population Distribution by Zone and State 1-11
Average State Radon Levels: LBNL vs. EPA (48 States & DC) R-Square=.616 LBNL EPA 1-12
EPA LBNL Average State Radon Levels Not Included : PR, GU, VI, HI, AK 1-13
Average State Radon Levels: LBNL vs. EPA (5 Outlier States Deleted) R-Square=.754 LBNL EPA 1-14
Estimate of State Radon-related Lung Cancer Deaths For each State(S) : Where: RD = Lung cancer deaths due to radon exposure in homes RL = Average Radon Level LCR = Lung cancer rate per 100,000 person years P = Population 0.135 = Percent lung cancer attributable to radon exposure (13.5%) 1-15
Annual Radon-related Lung Cancer Deaths Ratio of lives saved to mitigation/RRNC 1,542:1 Mitigation; 5,292:1 RRNC State 1-16
Annual Radon-related Lung Cancer Deaths Ratio of lives saved to mitigation/RRNC 1,542:1 Mitigation; 5,292:1 RRNC State 1-17