Download
1 / 7
70 likes | 155 Views
PREVALENCE ESTIMATES for County Reports. October.28, 2003 Judith B. Klotz Revised Dec. 2004 – Mar. 2005 DM Rosenblum, JB Klotz, SH Weiss UMDNJ. Review of Rationale. Prevalence definition and assumptions All survivors assumed to be prevalent cases Role of survival rates and migration

E N D
PREVALENCE ESTIMATESfor County Reports October.28, 2003 Judith B. Klotz Revised Dec. 2004 – Mar. 2005 DM Rosenblum, JB Klotz, SH Weiss UMDNJ
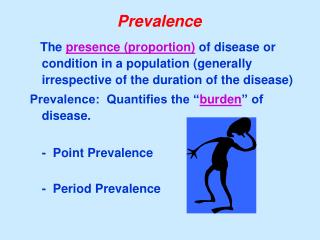
Review of Rationale • Prevalence definition and assumptions • All survivors assumed to be prevalent cases • Role of survival rates and migration • County survival rates could differ from national for any cancer, either gender • Survivors may not reside in county (or state) where they were diagnosed
Source Data • a. Crude incidence counts (actual numbers of newly diagnosed cases) for 1996-2000 as generated for the county by NJSCR, (all ages combined). • b. Prevalence/incidence rate ratios calculated by J.Klotz and distributed to C.E.s in September 2003.
Example: Sussex,Oral-oropharyngeal Male Female a. Crude incidence count (five-year total): 41 32 b. Prev/Inc rate ratios from Excel file 6.6 8.7
Actual Example of CalculationsSussex Oral-oropharyngeal: male 41 incident cases in men / 5 (years) x 6.6 (estimated) prevalent cases/incident cases = 54 (estimated) prevalent cases* -- the number of men currently alive who have been diagnosed with this cancer Note: dimensional analysis works! “men” in this calculation would be replaced by “women” when appropriate *Prevalence counts should be whole numbers, not fractions.
Documentation for Table • *1996-2000, per 100,000, age-adjusted to 2000 population, provided by NJSCR 2003 • **Calculated by UMDNJ from NPCR incidence rates, NCI prevalence estimates 2000, and U.S. Census