Download

1 / 41
490 likes | 1.22k Views
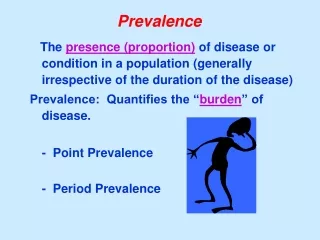
Prevalence. The presence (proportion) of disease or condition in a population (generally irrespective of the duration of the disease) Prevalence: Quantifies the “ burden ” of disease. - Point Prevalence - Period Prevalence. “Point” Prevalence. Number of existing cases

E N D
Prevalence The presence (proportion) of disease or condition in a population (generally irrespective of the duration of the disease) Prevalence: Quantifies the “burden” of disease. - Point Prevalence - Period Prevalence
“Point” Prevalence Number of existing cases P = -------------------------------- Total population At a set point in time (i.e. September 30, 1999)
“Point” Prevalence Example: On June 30, 1999, neighborhood A has: • population of 1,600 • 29 current cases of hepatitis B So, P = 29 / 1600 = 0.018 or 1.8%
“Period” Prevalence Number of existing cases Pp = -------------------------------- Total population During a time period (i.e. May 1 - July 31, 1999) Includes existing cases on May 1, and those newly diagnosed until July 31.
“Period” Prevalence Example: Between June 30 and August 30, 1999, neighborhood A has: • average population of 1,600 • 29 existing cases of hepatitis B on June 30 • 6 incident (new) cases of hepatitis B between July 1 and August 30 So, Pp = (29 + 6) / 1600 = 0.022 or 2.2%
Prevalence AXIOM: In general, a person’s probability of being captured as a prevalent case is proportional to the duration of his or her disease. Thus, a set of prevalent cases tends to be skewed toward cases with more chronic forms of the disease.
Mathematical Notation:A few measures used in Epidemiology render decimal numbers • Prevalence: 58 cases of diabetes 25,000 Subjects Prevalence = 0.00232 • Incidence: 34 new cases of breast cancer 54,037 Person-Years Incidence = 0.00063
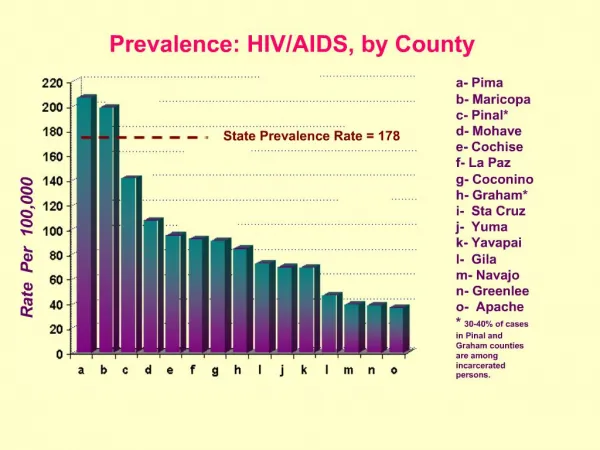
So that those numbers have a meaning, we add a population unit: Usually a power of 10 (10N) 101 = 10 102 = 100 103 = 1000 104 = 10000 Prevalence = 0.00232 * 105 = 232 cases of diabetes/100,000 Population Incidence = 0.00063 * 105 = 63 New cases of breast cancer/100,000 Person Years
Special Types of Incidence and Prevalence Measures INCIDENCE Mortality Rate # of Deaths over specified time Total Population Case Fatality Rate # of Deaths from a Disease # of Cases from that Disease Attack Rate # of Cases of a Disease Total Population at Risk for a Limited Period of Time PREVALENCE Birth Defect Rate # of Babies w/Given Abnormality # of Live Births
Discussion Question 4 How are incidence and prevalence of disease related?
Discussion Question 4 Prevalence depends on: - Incidence rate - Disease duration
Relationship between prevalence and incidence WHEN (the steady state is in effect): a) Incidence rate (I) has been constant over time b) The duration of disease (D) has been constant over time: ID = P / (1 – P) P = ID / (1 + ID) c) If the prevalence of disease is low (i.e. < 0.10): P = ID .
Uses of Incidence & Prevalence Measures Prevalence: Snap shot of disease or health event • Help health care providers plan to deliver services • Indicate groups of people who should be targeted for control measures • May signal etiologic relationships, but also reflects determinants of survival
Uses of Incidence & Prevalence Measures Incidence: Measure of choice to: --- Estimate risk of disease development --- Study etiological factors --- Evaluate primary prevention programs
Discussion Question 5 Why is incidence preferred over prevalence when studying the etiology of disease?
Discussion Question 5 Because, in the formula: P = I x D D is related to : - The subject’s constitution - Access to care - Availability of treatment - Social support - The severity of disease
Discussion Question 5 • So prevalent cases reflect factors related to the incidence of disease (Etiological factors), AND factors related to the duration of disease (Prognostic factors) • Thus, they are not adequate for studies trying to elucidate Disease Etiology
PROBLEMS WITH INCIDENCE AND PREVALENCE MEASURES Problems with Numerators: • Frequently, the diagnosis of cases is not straightforward • Where to find the cases is not always straightforward
PROBLEMS WITH INCIDENCE AND PREVALENCE MEASURES Problems with Denominators: • Classification of population subgroups may be ambiguous (i.e race/ethnicity) • It is often difficult to identify and remove from the denominator persons not “at risk” of developing the disease.
Summary of Incidence and Prevalence PREVALENCE: Estimates the risk (probability) that an individual will BE ill at a point in time • very useful to plan for health-related services and programs
INCIDENCE: - Estimates the risk (probability) of developingillness - Measures the change from “healthy” status to illness. • Useful to evaluate prevention programs • Useful to forecast need for services & programs • Useful for studying causal factors.
SUMMARY Cumulative incidence (CI): estimates the risk that an individual will develop disease over a given time interval Incidence rate (IR): estimates the instantaneous rate of development of disease in a population
OTHER MORTALITY MEASURES Proportionate Mortality: Proportion of all deaths attributed to a specific cause of death: No. of deaths from disease X in 1999 ----------------------------------------------- All deaths in the population in 1999 Can multiple by 100 to get a percent.
Discussion Question 6 Why isn’t proportionate mortality a direct measure of risk?
Discussion Question 6 Because: The proportion of deaths from disease X tells us nothing about the frequency of deaths in the population ---- the overall risk of death in the population may be low.
OTHER MORTALITY MEASURES Years of Potential Life Lost (YPLL): Measure of the loss of future productive years resulting from a specific cause of death. YPLL are highest when: • The cause of mortality is common or relatively common, AND • Deaths tends to occur at an early age.
Some Problems with Mortality Data • Cause of death reporting from death certificates is notoriously unreliable • Changing criteria for disease definitions can make analyses over time problematic
Survival Analysis •A technique to estimate the probability of “survival” (and also risk of disease) that takes into account incomplete subject follow-up. • Calculates risks over a time period with changing incidence rates. • Wide application in a variety of disciplines, such as engineering.
Survival Analysis • With the Kaplan-Meier method (“product-limit method”), survival probabilities are calculated at each time interval in which an event occurs. • The cumulative survival over the entire follow-up period is derived from the product of all interval survival probabilities. • Cumulative incidence (risk) is the complement of cumulative survival.
K-M formula: # of time intervals (Nk – Ak) S = ------------- k = 1 Nk Where: k = sequence of time interval Nk = number of subjects at risk Ak = number of outcome events
Survival Analysis Example: • Assume a study of 10 subjects conducted over a 2-year period. • A total of 4 subjects die. • Another 2 subjects have incomplete follow-up (study withdrawal or late study entry). What is the probability of 2-year survival, and the corresponding risk of 2-year death?
Interpretation: Is the risk of death constant over follow-up?
Survival Analysis • With the Kaplan-Meier method, subjects with incomplete follow-up (FU) are “censored” at their last known time of (FU). • An important assumption (often not upheld) is that censoring is “non-informative” (survival experience of subjects censored is the same as those with complete FU). • Non-fatal outcomes can also be studied.
Survival Analysis • The Life-Table method is conceptually similar to the Kaplan-Meier method. • The primary difference is that survival probabilities are determined at pre-determined intervals (i.e. years), rather than when events occur.