Download
1 / 53
530 likes | 606 Views
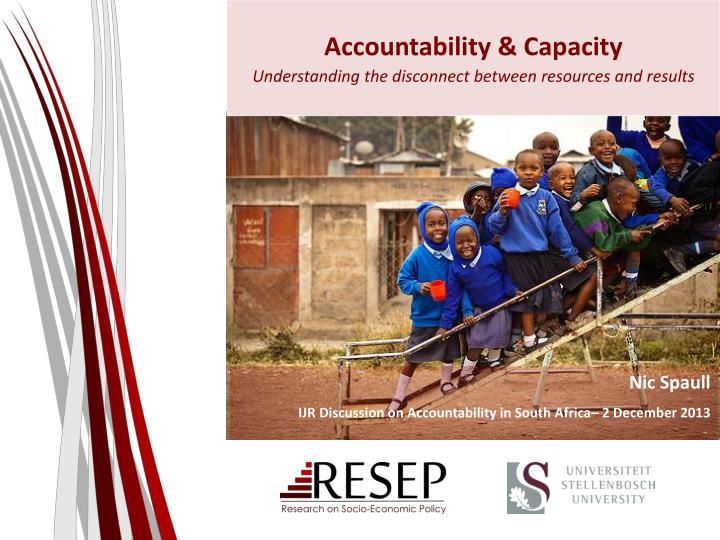
Accountability & Capacity Understanding the disconnect between resources and results. Nic Spaull IJR Discussion on Accountability in South Africa– 2 December 2013. Outline. Brief overview of SA education system Motivations for increasing resources Pro-poor allocation of resources

E N D
Accountability & Capacity Understanding the disconnect between resources and results Nic Spaull IJR Discussion on Accountability in South Africa– 2 December 2013
Outline • Brief overview of SA education system • Motivations for increasing resources • Pro-poor allocation of resources • Accountability without capacity (overview of IJR Transformation Audit chapter) 5. Capacity without accountability 6. Way forward…
Not all schools are born equal ? Pretoria Boys High School SA public schools?
Labour Market • University/FET • Type of institution (FET or University) • Quality of institution • Type of qualification(diploma, degree etc.) • Field of study (Engineering, Arts etc.) • High productivity jobs and incomes (17%) • Mainly professional, managerial & skilled jobs • Requires graduates, good quality matric or good vocational skills • Historically mainly white High quality secondaryschool Unequal society High SES background +ECD High quality primary school Minority (20%) Some motivated, lucky or talented students make the transition • Vocational training • Affirmative action • Big demand for good schools despite fees • Some scholarships/bursaries Majority (80%) Quality Type Attainment Low quality secondary school • Low productivity jobs & incomes • Often manual or low skill jobs • Limited or low quality education • Minimum wage can exceed productivity Low SES background Low quality primary school cf. Servaas van der Berg – QLFS 2011
Expenditure on education2010/11 Government exp on education (19.5% of Gov exp: R143.1bn) Total government expenditure (31% GDP in 2010/11 – R733.5bn) 17% 5%
Motivation for increasing resources • Basic dignity rationale (ethics / human rights) • Water, sanitation, electricity, brick buildings (Minimum Norms and Standards now published) • Power, water and sanitation within 3 years • Classrooms, e-connectivity and fencing within 7 years • Libraries and laboratories within 10 years • Improving learning outcomes rationale (achievement) • Existing research in SA shows exceedingly weak link between increased expenditures and improved outcomes • Allocation of new resources rarely based on evidence (‘I had a dream’ approach to policymaking) • LTSM / workbooks • Grade R • Libraries and laboratories? (difficult to motivate) • Nutrition programs
Pro-poor allocation of resources? • Are there real/significant differences in household SES and school resources between Q1, Q2 and Q3? • Rethinking how we measure quintiles • Is the allocation of financial resources pro-poor? • Allocated resources vs realized resources (differential efficiency) (Taylor 2011) • Pre and post parental ‘top-ups’/fees? • Is the allocation of human resources pro-poor? • How do we incentivize the best teachers to teach in the poorest schools? • Innovate, test and adapt need to experiment to see what can work 150% of teacher salaries for ‘high quality’ teachers to teach in township schools?
Important distinctions Often these 3 are spoken about interchangeably
Important distinctions Inefficiency / corruption
Important distinctions Inefficiency / corruption Lack of capacity
Important distinctions Inefficiency / corruption Lack of capacity Lack of accountability
Accountability without capacity • “Accountability systems and incentive structures, no matter how well designed, are only as effective as the capacity of the organization to respond. The purpose of an accountability system is to focus the resources and capacities of an organization towards a particular end. Accountability systems can’t mobilize resources that schools don’t have...the capacity to improve precedes and shapes schools’ responses to the external demands of accountability systems (Elmore, 2004b, p. 117). • “If policy-makers rely on incentives for improving either a school or a student, then the question arises, incentives to do what? What exactly should educators in failing schools do tomorrow - that they do not do today - to produce more learning? What should a failing student do tomorrow that he or she is not doing today?” (Loveless, 2005, pp. 16, 26).
Capacity without accountability • “In the absence of accountability sub-systems, support measures are very much a hit and miss affair. Accountability measures provide motivation for and direction to support measures, by identifying capacity shortcomings, establishing outcome targets, and setting in place incentives and sanctions which motivate and constrain teachers and managers throughout the system to apply the lessons learned on training courses in their daily work practices. Without these, support measures are like trying to push a piece of string: with the best will in the world, it has nowhere to go. Conversely, the performance gains achieved by accountability measures, however efficiently implemented, will reach a ceiling when the lack of leadership and technical skills on the part of managers, and curricular knowledge on the part of teachers, places a limit on improved performance. Thus, the third step in improving the quality of schooling is to provide targeted training programs to managers and teachers. To achieve optimal effects, these will need to connect up with and be steered by accountability measures” (Taylor, 2002, p. 17).
“Only when schools have both the incentive to respond to an accountability system as well as the capacity to do so will there be an improvement in student outcomes.” (p22)
Way forward?Binding constraints approach(Hausmann, Klinger & Wagner,2008)
The binding constraints approach • It is “based on the idea that not all constraints bind equally, and that a sensible and practical strategy consists of identifying the most serious constraint(s) at work” (Rodrik, 2009: 6) • Hypothetical example…
“The left hand barrel has horizontal wooden slabs, while the right hand side barrel has vertical slabs. The volume in the first barrel depends on the sum of the width of all slabs. Increasing the width of any slab will increase the volume of the barrel. So a strategy on improving anything you can, when you can, while you can, would be effective. The volume in the second barrel is determined by the length of the shortest slab. Two implications of the second barrel are that the impact of a change in a slab on the volume of the barrel depends on whether it is the binding constraint or not. If not, the impact is zero. If it is the binding constraint, the impact will depend on the distance between the shortest slab and the next shortest slab” (Hausmann, Klinger, & Wagner, 2008, p. 17).
Conclusion • Ensuring that public funding is actually pro-poor and also that it actually reaches the poor. • Understanding whether the motivation is for human dignity reasons or improving learning outcomes. • Ensuring that additional resources are allocated based on evidence rather than anecdote. • The need for BOTH accountability AND capacity. • Identify binding constraints and work from there.
Thank youComments & Questions welcomePresentation available online at www.nicspaull.com/research
BasicLiteracy and Numeracy (Gr 6) • What proportion of South African grade 6 children were functionally literate and functionally numerate? • Functionally illiterate: a functionally illiterate learner cannot read a short and simple text and extract meaning. • Functionally innumerate: a functionally innumerate learner cannot translate graphical information into fractions or interpret everyday units of measurement.
SACMEQ III (Spaull & Taylor, 2012) Literacy Numeracy
SA primary school: Gr6 Literacy – SACMEQ III (2007) Never enrolled 2% Functionally illiterate 25% Basic skills 46% Higher order skills : 27% Forthcoming paper with Stephen Taylor
Spending Spending by education departments, real (2005) Rand 2000/01 to 2010/11 OSD (Oxford Policy Management & Stellenbosch Economics, 2012)
Grade 6 Literacy SA Gr 6 Literacy Kenya Gr 6 Literacy 1% 5% 7% 25% 49% 46% 39% Public current expenditure per pupil: $258 Public current expenditure per pupil: $1225 Additional resources is not the answer 27%
Accountability: teacher absenteeism(SACMEQ III – 2007 – 996 teachers) 4th/15
Accountability: teacher absenteeism(SACMEQ III – 2007 – 996 teachers) 15th/15
$ Benefits of education Ed H S Ec • Improved human rights • Empowerment of women • Reduced societal violence • Promotion of a national (as opposed to regional or ethnic) identity • Increased social cohesion • Lower fertility • Improved child health • Preventative health care • Demographic transition • Improvements in productivity • Economic growth • Reduction of inter-generational cycles of poverty • Reductions in inequality Economy Health Society Specific references: lower fertility (Glewwe, 2002), improved child health (Currie, 2009), reduced societal violence (Salmi, 2006), promotion of a national - as opposed to a regional or ethnic - identity (Glewwe, 2002), improved human rights (Salmi, 2006), increased social cohesion (Heyneman, 2003), Economic growth – see any decent Macro textbook, specifically for cognitive skills see (Hanushek & Woessman 2008)
Accountability: teacher absenteeism • Teacher absenteeism is regularly found to be an issue in many studies • 2007: SACMEQ III conducted – 20 days average in 2007 • 2008: Khulisa Consortium audit – HSRC (2010) estimates that 20-24 days of regular instructional time were lost due to leave in 2008 • 2010: “An estimated 20 teaching days per teacher were lost during the 2010 teachers’ strike” (DBE, 2011: 18) • Importantly this does not include time lost where teachers were at school but not teaching scheduled lessons • A recent study observing 58 schools in the North West concluded that “Teachers did not teach 60% of the lessos they were scheduled to teach in North West” (Carnoy & Chisholm et al, 2012)
Accountability: teacher absenteeism(SACMEQ III – 2007 – 996 teachers) Limpopo KwaZulu-Natal Eastern Cape Western Cape % absent > 1 week striking 97% 81% 32% 82% % absent > 1 month(20 days) 48% 62% 22% 73% 12% % absent > 2 months(40 days) 0% 10% 5% 1.3 days a week
SACMEQ III (Spaull & Taylor, 2012) Literacy Numeracy
Gr 1 - Gr 2 - Gr 3 – Gr 4 – Gr 5 – Gr 6– Gr 7 – Gr 8 – Gr 9 - Gr 10 – Gr 11 – Gr 12 Foundation Phase Intermediate Phase Senior Phase FET Phase Matric • Grade 12 – Various • Roughly half the cohort ____________________________________ Underperformance • Of 100 students that enroll in grade 1 approximately 50 will make it to matric, 40 will pass and 12 will qualify for university Inequality • Subject combinations differ between rich and poor – differential access to higher education • Maths / Maths-lit case in point • Are more students taking maths literacy because THEY cannot do pure-maths, or because their TEACHERS cannot teach pure-maths?
Insurmountable learning deficits Gradients of achievement in the EASTERN Cape and in Quintile 5 (National) NB: Key assumption, 0.5 SD of national learning achievement is equivalent to one grade level of learning -agreement from TIMSS/PIRLS Spaull, 2013 Spaull 2013
Insurmountable learning deficits Gradients of achievement in the WESTERN Cape and in Quintile 5 (National) NB: WC has relatively high % of Q5 schools thus it should be more convergent by construction. Spaull, 2013 Spaull 2013
What are the root causes of low and unequal achievement? Matric pass rate Subject choice Throughput No. endorsements Media sees only this MATRIC Quality? Pre-MATRIC 50% dropout Low curric coverage Low accountability Weak culture of T&L Vested interests Low time-on-task No early cognitive stimulation Low quality teachers HUGE learning deficits…
Two school systems not one? Socioeconomic Status • Grade 6 [2007] • Data: SACMEQ • (Spaull, 2011)
Gr 1 - Gr 2 - Gr 3 – Gr 4 – Gr 5 – Gr 6– Gr 7 – Gr 8 – Gr 9 - Gr 10 – Gr 11 – Gr 12 Foundation Phase Intermediate Phase Senior Phase FET Phase PIRLS 2006 – see Shepherd (2011) prePIRLS 2011 • Grade 4 – all 11 languages • 433 schools, 19259 students ____________________________________ Underperformance • 29% of gr4 students did not reach the low international benchmark – they could not read • SA performs similarly to Botswana, but 3 years learning behind average Columbian Gr4 Inequality • Linguistic inequalities: Large differences by home language – Xitsonga, Tshivenda and Sepedi students particularly disadvantaged • PIRLS (2006) showed LARGE differences between African language schools and Eng/Afr schools • Howie et al (2011) • *Data now available for download
In most government reports outcomes and inputs are not usually reported by quintile, only national averages