Download
1 / 30
330 likes | 787 Views
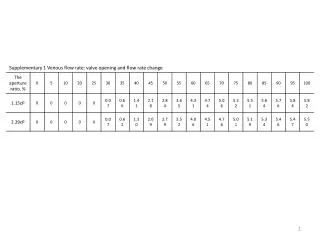
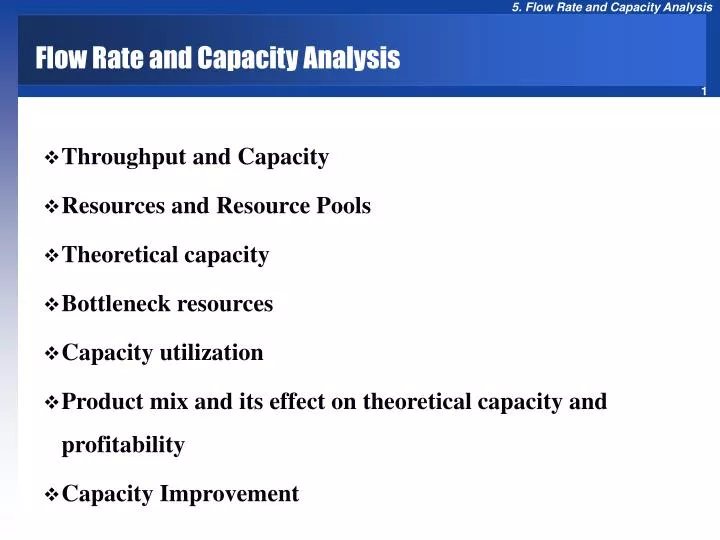
Flow Rate and Capacity Analysis. Throughput and Capacity Resources and Resource Pools Theoretical capacity Bottleneck resources Capacity utilization Product mix and its effect on theoretical capacity and profitability Capacity Improvement. Throuhput and Takt Time.

E N D
Flow Rate and Capacity Analysis • Throughput and Capacity • Resources and Resource Pools • Theoretical capacity • Bottleneck resources • Capacity utilization • Product mix and its effect on theoretical capacity and profitability • Capacity Improvement
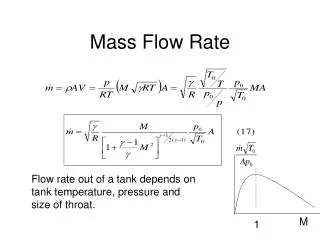
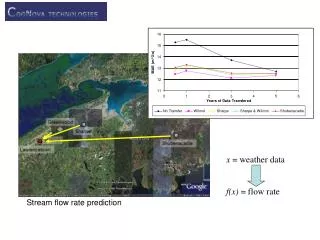
Throuhput and Takt Time • Throughput: Average Flow Rate • The average number of flow units that flow through a process per unit of time in a stable process • Takt time = 1/(throughput) • The time interval between exit of two consecutive products. The average activity time at a workstation on an assembly line. • Process Capacity • The maximum sustainable flow rate of a process
Resources in a Process Process Management Information structure Network of Activities and Buffers Inputs Outputs Goods Services Flow units (customers, data, material, cash, etc.) Resources Labor + Capital
Resources and Resource Pools • Resources • Capital – Fixed Assets such as land, buildings, facilities, equipment and machinery • Labor – people such as engineers, operators, assemblers, chefs customer-service representatives, etc. • Resource Unit: An individual resource (chef, mixer, oven etc) • Resource Pool: A collection of interchangeable resource units that can perform an identical set of activities • Resource Pooling: The combining of separate resource pools into a single pool to perform several activities • Unit Load of a Resource Unit (Tp):The amount of time the resource works to process each flow unit
Flow Rate Measurement • Theoretical capacity of a resource unit – maximum sustainable flow rate if it were fully utilized • Theoretical capacity of a resource pool – sum of all the theoretical capacities of all the resource units in that pool • Bottleneck – the slowest resource pool of a process • Theoretical bottleneck – The resource pool with the minimum theoretical capacity • Theoretical capacity of a process – theoretical capacity of the theoretical bottleneck
The Theoretical Capacity • Theoretical Capacity of a Resource unit = 1/unit load = 1/ Tp • Theoretical capacity of a Resource pool = Rp = cp/ Tp
Other Factors Affecting Theoretical Capacity • Load batching – a resource processes several flow units simultaneously (one oven and 10 loaves of bread) • Scheduled availability – The amount of time that a resource is schedule for operation. (certain hours, certain days, total hours per week) • Theoretical capacity of a resource unit = • (1 / Tp) × Load batch × Scheduled availability • Theoretical capacity of a resource pool = • Rp =(cp / Tp) × Load batch × Scheduled availability
Theoretical Capacity for Physicians Claims (Revised) • Claims supervisors are the bottleneck and theoretical capacity is 545 claims per day
Throughput and Capacity Utilization • Throughput is rarely equal to theoretical capacity because of • Internal inefficiencies(resource unavailability or idleness) • External inefficiencies(low inflow/supply or low outflow/demand) • Capacity utilization of a resource pool (ρp) – Measures degree to which resources are effectively used by a process. • ρp = Throughput/Theoretical capacity of a resource pool = R/Rp
Capacity Utilization Throughput = 480 The capacity utilization of the entire process is 88%
Unit Load for a Product Mix • Unit load for a given product mix is computed as the weighted average of unit loads of individual products. • Billing: Physician claims, Hospital claims, and 60/40 mix
Theoretical Capacity for 60% / 40% Mix • Linear Programming: Find the optimal product mix to maximize profit. • Greedy Algorithm. Produce products with highest unit contribution margin
Optimizing Profitability: Wonder Shed exampl • Decisions of product mix affect process capacity which therefore affect profitability • Optimize profitability by producing products with highest unit contribution margin • keep in mind: unit load, resource capacity, and process capacity • Contribution Margin – revenue less all of its variable costs • Contribution Margin per Unit Standard = $200 Fancy = $260 • Contribution Margin Per Unit of Time Standard 2 × $200 = $400 per hour Fancy 1.2 × $260 = $312 per hour
Why Wasted Time? • Process capacity is usually less than the theoretical capacity due to process inefficiencies (time wasted). • Resource availability loss: resource is not available • Breakdown or absenteeism • Preventive maintenance • Scheduled availability: the scheduled time period during which a resource unit is available for processing flow units • Net availability = Schedule availability – Lost time due to breakdown and maintenance • Availability loss factor = 1 – (Net Availability/Scheduled Availability) • Resource idleness: resource is available but is not processing • Starvation: Idleness of resources due to the unavailability of inputs • Blockage: When resources are prevented from producing because there is no place to store (internal), or there is no demand (external)
Setup Batch, Unit Load, Total Unit Load • Setup or Changeover: activities related to cleaning, resetting and retooling of equipment in order to process a different product. • Qp : Setup batch or lot size; the number of units processed consecutively after a setup; • Sp :Average time to set up a resource at resource pool p for a particular product • Average setup time per unit is then Sp / Qp • Tp = Unit load (it does not count for the setup time) • Total unit load = Tp + Sp / Qp • What is the “right” lot size or the size of the set up batch? Lot Size or ? • The higher the lot size, the lower will be the total unit load and thus the higher the capacity. • The higher the lot size, the higher will be the inventory and therefore, the higher the flow time. • Reducing the size of the setup batch is one of the most effective ways to reduce the waiting part of the flow time.
Total Unit Load for Products, and a Product mix Two Sizes Tiles Cutting time Setup time Regular 300 units (75%) 2 minutes 30 minutes Jumbo 100 units (25%) 1 minute 30 minutes • Load batch: the number of units processed simultaneously. Often constrained by technological capabilities of the resource. • Setup batch: the number of units processed consecutively after a setup. Setup is determined managerially
Effective Capacity of a Process • Theoretical Capacity of a resource unit: (1/Tp) ×Load Batch ×Scheduled Availability • Effective Capacity of a resource unit : (1/Total Unit Load) × Load Batch ×Net Availability • Effective Capacity takes into account the setup per unit time (Total unit load) and the resource availability loss (Net availability) • The effective capacity of a pool is the effective capacity of all resources in the pool: (cp/Total Unit Load) × Load Batch ×Net Availability • Cp is the number of units in the resource pool • Total unit load= Tp+(Sp/Qp) • The effective capacity of a process is the effective capacity of its slowest resource pool (effective bottleneck).
Resource Pools, Effective Capacity Effective capacity = (cp/Total Unit Load) × Load Batch ×Net Availability
Levers for Managing Throughput • Theoretical capacity • The theoretical capacity of the theoretical bottleneck. • Rp = cp/Tp× Load batch × Scheduled availability • Effective capacity • Replace Schedule availability with net availability • Replace Unit load (Tp) by Total unit load Tp+Sp/Qp. That is unit load plus setup per unit in the setup batch • Process capacity • Is less than Effective Capacity Resource idleness due to starvation and blockages • Throughput • Average flow rate per unit Note: (1/throughput = Takt time) • Throughput ≤ Process capacity ≤ Effective capacity ≤ Theoretical capacity
Improving Theoretical Capacity • Decrease unit load on the bottleneck: Decrease the work content of the activity performed by the bottleneck resource pool • Increase the Load Batch of the bottleneck resource: Expanding the resource will increase resource capacity • Increase the number of bottleneck resources: Adding units to the bottleneck resource pool will increase resource capacity • Increase Scheduled Availability of bottleneck resource: Add more hours to the resource such as adding overtime or second shift operations
Internal and External Bottlenecks • Internal Bottleneck: When Throughput is equal to Process Capacity • The output of the process is limited by the process’s own constraints (the bottleneck resource) • External Bottleneck: When Throughput is less than to Process Capacity • The output of the process is limited by conditions external to the the boundaries of the internal process constraints. • Examples include: demand for product, raw material shortages • If process capacity is close to throughput, the dominating effect is internal (recourse unavailable; breakdowns, preventative maintenance, set up). You should increase net availability of the bottleneck resource pools and reduce setup waste. • If effective capacity is close to the theoretical capacity the dominating effect is external (starvation, blockage). The way to raise capacity in this case is to reduce idleness.
Increase net availability, Reduce setup • Increasing net availability • Regular Maintenance of equipment • Reduces breakdowns during manufacturing process • Perform maintenance after production line shutdown • Have problem solving measures in place to keep the manufacturing process functioning • Reducing setup waste • Planning • Reduce the frequency of changeovers • Managing the product mix • Reduce the amount of time required to setup a line • Caution: Increasing batch size or length of run leads to increased inventory and longer flow times.
Decrease resource idleness • Decreasing resource idleness • Starvation and Blockage are the problems. • If we have two raw material for a process and one is unavailable we have a starvation condition • If the buffer is not big enough upstream and there is no place for the product to go we have a blockage condition • Techniques to avoid Starvation and Blockage • Proper buffer size • Process flow synchronization • Internal bottle neck will require increasing the capacity of the bottle neck to a capacity where a new bottleneck will appear. Once the old bottleneck does not have the lowest capacity do not continue to increase capacity. It will not increase overall capacity any further.