Download
1 / 12
130 likes | 344 Views
Objective- To solve problems involving data analysis and measures of central tendency. Data Analysis. 1) Range 2) Measures of Central Tendency Mean Median Mode. 10 20 20 30 40. Range = Highest Value - Lowest Value. Range = 40 - 10. Range = 30. 10 20 20 30 40.

E N D
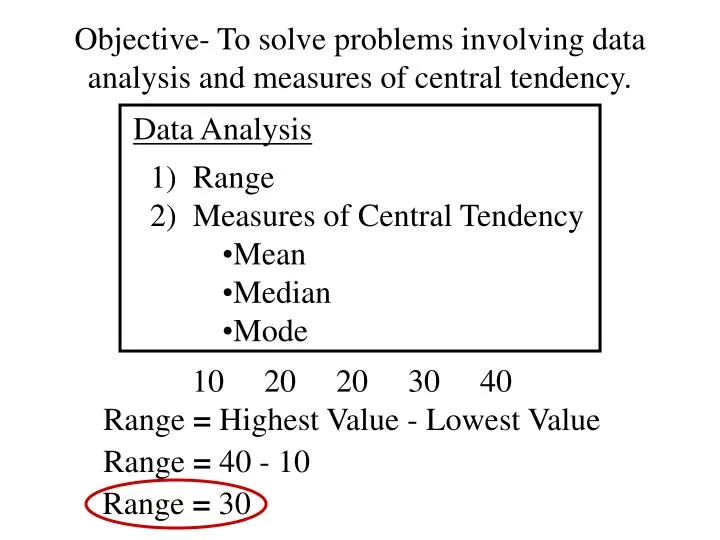
Objective- To solve problems involving data analysis and measures of central tendency. Data Analysis • 1) Range • 2) Measures of Central Tendency • Mean • Median • Mode 10 20 20 30 40 Range = Highest Value - Lowest Value Range = 40 - 10 Range = 30
10 20 20 30 40 Measures of Central Tendency Sum of the numbers Mean = # of the numbers 10 + 20 + 20 + 30 + 40 120 Mean = = # of the numbers 5 Mean = 24 Median = Middle of the Numbers Median = 20 Mode = Number which Occurs Most Often Mode = 20
Organizing Data 5 6 6 7 8 8 7 9 4 6 6 5 8 6 7 8 6 6 9 8 Line Plot Frequency Table 4 5 6 7 8 9 4 5 6 7 8 9
Organizing Data 5 6 6 7 8 8 7 9 4 6 6 5 8 6 7 8 6 6 9 8 Line Plot Frequency Table 4 5 6 7 8 9 4 5 6 7 8 9
Organizing Data 78 73 64 85 91 104 62 80 92 75 84 73 61 96 Stem-Leaf Plot 10 9 8 7 6 4 2 6 1 4 0 5 3 8 3 5 2 1 4
sum # Median = Mode = Find the mean, median, mode. 25 24 18 16 12 19 17 12 16 17 18 19 24 25 131 Mean = = 7 Middle of the Numbers Median = 18 Number which Occurs Most Often Mode = No mode
sum # Median = Mode Range = = Find the mean, median, mode , and range. 84 96 84 95 101 62 62 84 84 95 96 101 522 Mean = = 6 Middle of the Numbers 84 + 95 Median = 2 Number which Occurs Most Often Mode = 84 High - Low 101 - 62 = 39
sum # Median = Range Mode = = Find the mean, median, mode , and range. 12 74 74 82 82 96 420 Mean = = 6 Middle of the Numbers 74 + 82 Median = 2 Number which Occurs Most Often Mode = 74 and 82 High - Low 96 - 12 = 84
sum # Median = Mode Range = = Use the line plot below to find the following: 10 12 13 14 15 133 Mean = = 10 14 + 14 2 14 High - Low 15 - 10 = 5
sum # Median = Range Mode = = Use the stem-leaf plot below to find the following: 6 5 4 3 2 1 691 0 Mean = = 16 3 6 8 2 44 + 44 3 4 0 4 5 2 2 1 25 and 44 5 2 5 High - Low 61 - 22 = 39
sum sum # 5 (6) (6) (5) (5) Ben has a 78% average on his first 5 tests. What grade will he need on his next test to raise his test average to 80%? Let x = next test grade Mean = 390 + x 80 = 6 78 = 480 = 390 + x -390 -390 390 = sum 90 = x He needs a 90% on his next test
sum sum # 7 (6) (6) (7) (7) ( ) (-1) (-1) Sheila has a 89% average on his first 7 quizzes. If she is allowed to drop her lowest score, her average will increase to 92%. What score will she drop? Let x = lowest quiz score Mean = 623 - x 92 = 6 89 = 552 = 623 - x -623 -623 623 = sum -71 = -x 71 = x 71% should be dropped