Download
1 / 19
190 likes | 334 Views
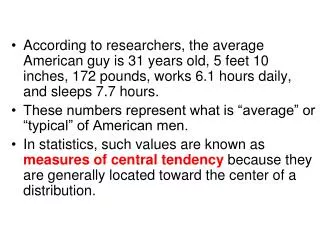
Measures of central tendency. 1. The mean. It si a function of all the values of a distribution It can be computed for quantitative variables It is the point of equillibrium or baricenter of the distribution It is the easiest measures to summarize values. 2. Calculate the mean of revenues.

E N D
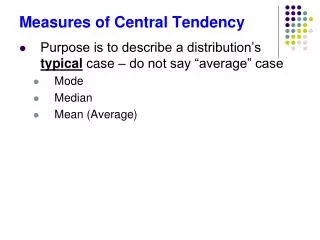
The mean It si a function of all the values of a distribution It can be computed for quantitative variables It is the point of equillibrium or baricenter of the distribution It is the easiest measures to summarize values 2
Calculate the mean of revenues If we know the values of the revenues for 9 shops we can caluculate the mean as unique summary measure We have to add all the values of the revenues and divide them by the number of observations considered (n=9) 3
How to calculate the mean Sum of the revenues = 350 + 200 + 600 + 500 + 270 + 180 + 205 + 340 + 280 = 2925 Mean of the revenues = 2925:9=325 Σ=2925 4
Formula of the mean 100 200 300 400 500 600 700 • For n observations x1, x2,…, xn of a quantitative variable X Mean = 325 5
Effect of extreme values If the maximum value would be 800 instead of 600 the mean will increase (the equilibrium point moves right) 100 200 300 400 500 600 700 800 Mean = 347,22 The mean is very affected from extreme values 6
Weighted mean A student ahs done the following exams. How to calculate the mean of the values? 8
Weighted mean: how to calculate it The mean degree (on 39 cfu) is 24,92 9
Weighted mean The two lowest degree have less weight in the mean because they have only 6 cfu 18 19 20 21 22 23 24 25 26 27 28 29 30 Weighted mean = 24,92 10
Median • It can be computed for variables that are almost sorted • It is good also in case of extreme values • It is a quantile (2° quartile, 50° percentile) 11
Median It is the value the stay in the central position in the sorted list of all the values Between x(1) and Me stay 50% of the values Between Me and x(n) and Me stay 50% of the values X(1) Me X(n) 12
Median from a frequency distribution (rel. Cum. freq.) In the column of relative culative frequency we search for the first Fj that is equal or greather than 0,5 The corresponding value xj is the median of the distribution. Median=6 13
The choice between mean and median Fonte: Walter Kramer (2009), Le bugie della statistica, Nimesis
Mode It can be computed for any kind of variable It is the most frquent item 15
Mode of a group of values Mode=“male” The gender of director most repeated is (5 times ) “male” 16
Mode of a frequency distribution Mode=6 The highest frequency is 3 The value of the number of employee with the highest frequency is 6 17
Mode • It can not exist • It can not be unique 18