Download
1 / 30
300 likes | 306 Views
This study aims to understand past and predict future changes in the climate and ecosystem of the eastern Bering Sea. By simulating historical and future scenarios, key linkages and impacts of climate change on the Bering Sea ecosystem will be identified. The study will also develop a high-resolution modeling system for the Bering Sea that incorporates data assimilation capabilities.

E N D
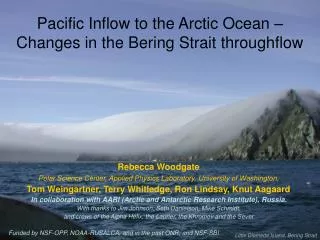
Jinlun Zhang Polar Science Center NSF BEST workshop 2006 The Impact of Changes in Sea Ice on the Physical Forcings of the Eastern Bering Ecosystem − Retrospective Investigation and Future Projection Jinlun Zhang Rebecca Woodgate PSC/APL/UW
Motivation • Source of over 50% of the total US fish catch. • Home to immense populations of birds and marine mammals. • Support of subsistence activities of Native communities. • The extraordinarily productive Bering ecosystem is vulnerable to climate change. • Significant climate regime shifts have occurred in the past decades. • Further climate and ecosystem change is likely, with substantial economical and social implications. • Essential to understand past change in the eastern Bering climate and ecosystem and to predict the timing and scope of future change. • Retrospective investigation and future projection
Scientific Objectives • Simulate the historical evolution and regime shifts of the eastern Bering ice-ocean system from 1970 to the present, to quantify the ice-ocean climate changes that have affected the ecosystem. • Identify key linkages among the atmosphere, sea ice, and ocean, to understand mechanisms affecting physical forcings of biological processes. • Examine the interactions between the Bering Sea climate and the Pacific and Arctic climate, to assess the Bering climate system’s vulnerability to and influence on hemispheric climate change. • Estimate the impacts of projected future anthropogenic global climate change (including an ice-free regime) on the eastern Bering Sea system, specifically focusing on changes in ice-ocean climate and the physical forcings of biological systems.
The Bering Ecosystem STudy ice-ocean Modeling and Assimilation System (BESTMAS)− Synthesis and modeling of the eastern Bering Sea
Technical Objectives • Construct and verify BESTMAS that emphasizes the eastern Bering Sea with high resolution and its links to the Arctic and the Pacific. • Incorporate data assimilation capabilities into BESTMAS; assimilate satellite data of ice concentration and SST. • Model and assimilate the eastern Bering Sea from 1970 to 2009; examine key physical processes relevant to the ecosystem, such as wind and tidal mixing, buoyancy forcings, stratification, formation and maintenance of cold pools and thermal fronts, and shelf-basin exchange via eddies, upwelling, and other mechanisms. • Synthesize model results with other BEST projects, via synergistic analysis of model simulations and field data; support field planning of BEST observational work with a 4-dimensional analysis of the Bering Sea, identifying key processes and possibly optimal sampling sites. • Perform future predictions of change in the Bering ice-ocean climate and physical forcings of the ecosystem under several global warming scenarios, especially those that may lead to an ice-diminished or ice-free marine ecosystem.
BESTMAS Grid Configuration Nested to a medium-resolution global ice-ocean model; OBs along 35oN
Key Features of BESTMAS • A coupled Parallel Ocean and sea Ice Model (POIM, Zhang/Rorhrock 2003). • Multi-category thickness & enthalpy distribution (TED) sea ice model; multiple snow categories (Zhang/Rothrock 2000). • Sea ice dynamics model for efficient, stable, high-resolution simulation (Zhang/Hibler 1997). • Parallel Ocean Program (POP, Dukowicz/Smith 1994). • Nested to a global ice-ocean model for open boundary conditions. • Incorporate tidal forcing (8 components) • Assimilate satellite ice concentration and SST. • No biological model, but can incorporate passive tracers.
Further Improvements of BESTMAS Physics • Sea ice rafting. • Teardrop plastic sea ice rheology. • Lateral melting. • Latest POP ocean model. • Spatially varying anisotropic viscosity. • Partial bottom cells.
BESTMAS Validation (In addition to assimilating ice concentration and SST) • Moored measurements and survey data of ice thickness. • Ice motion derived from Synthetic Aperture Radar data. • Satellite tracked drifting buoys for validating surface ocean velocities. • Hydrographic and mooring data from Bering Sea projects (FOCI, PROBES, NPCREP …). • Possible data from BEST projects (later stage). • Observational estimates of transports through major Aleutian Passes and Bering Strait.
Retrospective Investigations of Changes in the Eastern Bering Sea (hindcast of 1970−2009 with several detectable regime shifts) • What drives the variability and retreating of the Bering ice cover over the past decades? • How does ice affect ocean processes and the physical forcings relevant to biological processes? • What is the importance of currents, eddies, and meanders for cross- and on-shelf fluxes in the Bering Sea? • What is the role of tides? • How would changes in flow into the Bering Sea affect the circulation within the Bering Sea? • How would changes in the Bering St. throughflow affect the circulation in the Bering Sea?
Future Projections of the Eastern Bering Sea • Scenario 1: Using reanalysis forcing with warming bias linked to high PDO/AO. => Aleutian low would be anomalously low with anomalously warm spring air temperature (Stabeno/Overland 2001), and the water temperature along the west coast of North America would be anomalously warm. • Scenario 2: Adding green house warming. => Assuming the eastern Bering Sea is affected by the projected arctic and global warming due to anthropogenic influences; annual average temperatures are projected to rise by 7oC by the end of this century from 5 ACIA climate models based on IPCC B2 emissions scenario; this temperature increase will be superposed on the model forcing.
Key Questions to be Addressed by Future Projections • How rapidly does the ice cover retreat under each scenario? When, where, and under what circumstances is the Bering Sea ice free in spring and in winter? • What are the characteristics of the exchange of heat, mass, and momentum at the surface of an ice-diminished or ice-free eastern Bering Sea? What are the consequences on water column mixing and stratification? • What changes occur in the strength and pattern of the Aleutian North Slope Current, the Bering Slope Current, the Alaska Coastal Current, other major currents, and eddy activities in the slope region? What are the consequences on the cross-shelf and on-shelf transport of heat, water, and nutrients? • How do the Aleutian and Bering Strait throughflows change? What are the consequences to the interactions between the Bering Sea and the Arctic as well as the central North Pacific? • How does the ocean temperature change in time and space?
http://psc.apl.washington.edu/BEST Outreach * Website – modeling results, data sets (in addition to archiving at ARCSS Data Ctr) * Interactions with WA, OR and CA fishermen working in the Bering via the PLP * Polar Science Weekend at the Pacific Science Center (Seattle) * Undergraduates working on modeling and data studies
Preliminary Results (A BESTMAS simulation without data assimilation)
Regime shifts related to ice conditions; most noticeable shifts around 1977 and 1998 (e.g., Niebauer 1998; Hunt and Stabeno, 2002).
Movie of Monthly Mean Model Simulated Ice Thickness and Satellite Observed Ice Edge Ice concentration and SST data have not been assimilated yet
Temperature has generally Increased since the mid 1970s
8/2005 surface velocity With tidal forcing Every 4th vector plotted Stabeno et al. 1999
Effect of tidal forcing With tidal forcing Tidal forcing induces an observed clockwise circulation around the Pribilof Islands (Kowalik/Stabeno, 1999). Tidal rectification also causes stronger currents in some coastal areas. Without tidal forcing
Difference between summer and winter 2005 Summer (8/2005) This particular winter has stronger flows than summer: Stronger inflows through Aleutian passes. Stronger on-shelf currents. Stronger Kamchatka current. Wind forcing may play a dominant role in the seasonal difference. Winter (1/2005)
Variance explained by correlations of ice thickness for each location with the total ice volume of the eastern Bering Sea Location is robust after a sufficiently long simulation (Over 1970−1994)
Variance explained by correlations of upper 100 m ocean temperature for each location with the mean upper 100 m temperature of the eastern Bering Sea (Over 1970−1994)
A List of BESTMAS Output Parameters • Sea ice thickness distribution over categories, concentration/extent, growth/melt, deformation, and ridging/rafting information. • Snow depth. • Surface heat fluxes (radiative, sensible, and latent). • Surface salt and freshwater fluxes. • Surface momentum flux. • Surface light penetration. • 3-D ocean temperature, salinity, and velocity. • Sea surface height. • Time series of Aleutian and Bering Strait throughflows. • What else? Feedback from other BEST researchers.
What can BESTMAS do for Field Work Planning and for Data Analysis? • What BESTMAS output parameters are useful for field work planning? • What information can be derived from BESTMAS output for planning? • Any additional parameters should be added on the list? Both for planning and for science. • Temporal resolution for BESTMAS output? • Any more model runs should be conducted? Specifically designed? • Any more model improvements should be considered? • Timeline?