Download
1 / 50
500 likes | 654 Views
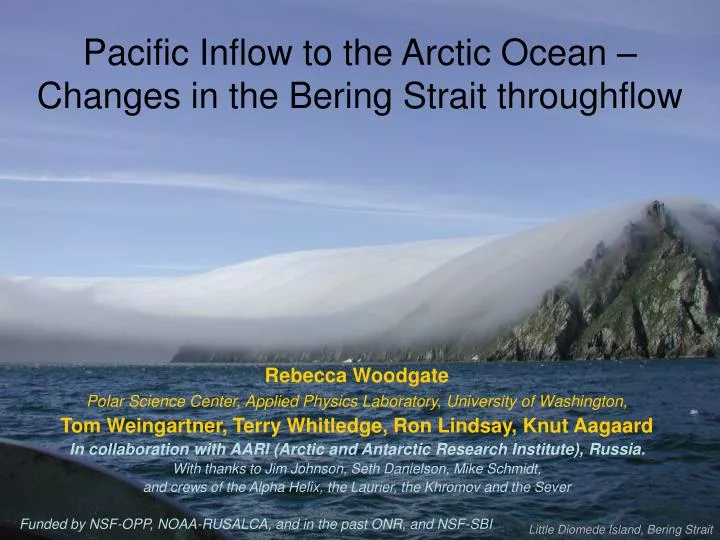
Pacific Inflow to the Arctic Ocean – Changes in the Bering Strait throughflow. Rebecca Woodgate Polar Science Center, Applied Physics Laboratory, University of Washington, Tom Weingartner, Terry Whitledge, Ron Lindsay, Knut Aagaard

E N D
Pacific Inflow to the Arctic Ocean – Changes in the Bering Strait throughflow Rebecca Woodgate Polar Science Center, Applied Physics Laboratory, University of Washington, Tom Weingartner, Terry Whitledge, Ron Lindsay, Knut Aagaard In collaboration with AARI (Arctic and Antarctic Research Institute), Russia. With thanks to Jim Johnson, Seth Danielson, Mike Schmidt, and crews of the Alpha Helix, the Laurier, the Khromov and the Sever Funded by NSF-OPP, NOAA-RUSALCA, and in the past ONR, and NSF-SBI Little Diomede Island, Bering Strait
Pacific Gateway to the Arctic Ocean Why care about the Bering Strait? What are we doing, and what are we finding? What next? Little Diomede Island, Bering Strait
The Arctic Ocean Little Diomede Island, Bering Strait
RUSSIA NORWAY ICELAND GREENLAND USA CANADA ARCTIC OCEAN NOAA.gov You are down here somewhere
Figure from Harry Stern, UW 1500 miles 2500 miles TOTAL Arctic Ocean area ~ 2 x lower 48 ~ 1.5 x USA Russia Alaska Canada Greenland Smallest of world’s 5 major oceans (Pacific, Atlantic, Indian, Southern, and Arctic)
Russia 80N Barents Sea Nansen-Gakkel R Lomonosov Ridge Fram Strait Eurasian Basin Greenland Sea Mendeleev Ridge Bering Strait Canadian/Amerasian Basin Greenland Canadian Archipelago Alaska ATLANTIC LAYER - warm, salty - largest volume input - follows slopes and ridges ... SLOWLY (a few cm/s – 8hrs for 1 mile) - strong “eddies” within that flow - likes to stick to a depth contour .. MOSTLY - takes more than 10-20-30 .. years to get back out!
Russia 80N Barents Sea Nansen-Gakkel R Lomonosov Ridge Fram Strait Eurasian Basin Greenland Sea Mendeleev Ridge Bering Strait Canadian/Amerasian Basin Greenland Canadian Archipelago Alaska PACIFIC WATER - nutrient rich - source of heat and freshwater - follows slopes a bit (and faster!), but also crosses basins ... in response to wind?? - eddies important again - keeps nutrients high in the water - takes 10 years or less to cross Arctic
Weingartner and Danielson Bering Strait Connections ARCTIC Bering Strait Only Pacific Gateway to the Arctic Ocean To the SOUTH – BERING SEA (over 50% of US fish catch) - Bering Strait throughflow could drain Bering Sea Shelf in about 1 year To the NORTH – CHUKCHI SEA (future US fish catch????) - Bering Strait throughflow drives properties and throughput of the Chukchi Sea. PACIFIC
Bering Strait Basics The only Pacific gateway to the Arctic Ocean • ~ 85 km wide • ~ 50 m deep • divided into 2 channels by the Diomede Islands • - split by the US-Russian border • ice covered from ~ January to April • - annual mean northward flow ~0.8 Sv • dominates the water properties of the Chukchi Sea • - is an integrator of the properties of the • Bering Sea • (Coachman et al, 1975; • Woodgate et al, 2005) Why does a little Strait matter so much?
150 150 50 100 20 15 50 50 50 50 350 150 350 500 The role of Pacific waters in the Arctic Important for Marine Life Pacific waters are the most nutrient-rich waters entering the Arctic (Walsh et al, 1989) Primary Productivity gC m-2 yr-1 Courtesy of (and adapted from) Codispoti, Stein, Macdonald, and others, 2005
20% 50% The role of Pacific waters in the Arctic Chlorophyll from SeaWifs Satellite from NASA/Goddard Space Flight Center and Orbimage Sea ice concentration from SSMI (IABP) Implicated in the seasonal melt-back of ice In summer, Pacific waters are a source of near-surface heat to the Arctic (Paquette & Bourke, 1981; Ahlnäs & Garrison, 1984)
The role of Pacific waters in the Arctic Pacific winter waters Important for Arctic Stratification In winter, Pacific waters (fresher than Atlantic waters) form a cold (halocline) layer, which insulates the ice from the warm Atlantic water beneath (Shimada et al, 2001, Steele et al, 2004)
The role of Pacific waters in the Arctic Largest Interannual Variability?? ARCTIC FRESHWATER FLUXES Bering Strait ~ 2500 km3/yr (0.08 Sv) Arctic Rivers ~ 3300 km3/yr P-E ~ 900 km3/yr Fram Strait water ~ 820 km3/yr Fram Strait ice ~ 2790 km3/yr Canadian Archipelago ~ 920 km3/yr Significant part of Arctic Freshwater Budget Bering Strait throughflow ~ 1/3rd of Arctic Freshwater (Wijffels et al, 1992; Aagaard & Carmack, 1989; Woodgate & Aagaard, 2005)
The role of Pacific waters in the Arctic Largest Interannual Variability?? Important for Marine Life Pacific waters are the most nutrient-rich waters entering the Arctic (Walsh et al, 1989) Significant part of Arctic Freshwater Budget Bering Strait throughflow ~ 1/3rd of Arctic Freshwater (Wijffels et al, 1992; Aagaard & Carmack, 1989; Woodgate & Aagaard, 2005) Important for Arctic Stratification In winter, Pacific waters (fresher than Atlantic waters) form a cold (halocline) layer, which insulates the ice from the warm Atlantic water beneath (Shimada et al, 2001, Steele et al, 2004) Implicated in the seasonal melt-back of ice In summer, Pacific waters are a source of near-surface heat to the Arctic (Paquette & Bourke, 1981; Ahlnäs & Garrison, 1984)
Broecker, 1991 Global role of Bering Strait A Freshwater source for the Atlantic Ocean Pacific waters exit the Arctic into Atlantic Deep Water formation regions (Jones et al, 2003) - slowing the Atlantic Ocean overturning circulation(see Wadley & Bigg, 2002) -affecting deep western boundary currents & Gulf Stream separation(Huang & Schmidt, 1993)
Paleo role of Bering Strait Stabilizer for World Climate? (DeBoer & Nof, 2004; Hu & Meehl, 2005) - if Bering Strait is open, excess freshwater in the Atlantic “vents” through the Bering Strait, allowing a speedy return to deep convection in the Atlantic. Land Bridge for migration of mammals and people? www.debbiemilleralaska.com Note: in modern times, people have swum, driven and walked across!
Sea Surface Temperature 26th August 2004, from MODIS/Aqua level 1 courtesy of NASA/Goddard Space Flight Center, thanks to Mike Schmidt Grey arrow marks the Diomede Islands (Little and Big Diomede). Observational Challenges of Bering Strait - shallow (50 m) - stratified in spring/summer - important seasonal boundary currents (e.g. Alaskan Coastal Current) - ice covered (keels to 20 m) from ~ January to April - split by the US-Russian border Eastern Bering Strait in Winter
Russian-US Long-Term Census of the Arctic - John Calder - Kathy Crane Joint US Russian cruises and moorings since 2004
Your instrument here!!!! Bering Strait Long-term Moorings Since 1990 1-4 near–bottom moorings Since 2007 (International Polar Year) 8 moorings with upper and lower sensors - Understand the Physics - Design a Monitoring Scheme
3 2 ICE 1 4 AUG APRIL Seasonal cycle in water properties (Woodgate et al, 2005) SALINITY 31.9 to 33 psu TEMPERATURE -1.8 to 2.3 deg C TRANSPORT 0.4 to 1.2 Sv (30 day means) • WHY CARE? • Seasonally varying input to the Arctic Ocean • - temperature • - salinity • -volume • - equilibrium depth • (~50m in summer • ~120m in winter) • nutrient loading (1) Maximum temperature in late summer (2) Autumn cooling and freshing, as overlying layers mixed down (3) Winter at freezing point, salinisation due to ice formation (4) Spring freshening (due to ice melt) and then warming
Interannual Variability (up to 2004) Warming since 2001 Increasing flow since 2001 (mostly attributable to changes in local wind) Woodgate et al, 2006, GRL
Scale of variability Extra heat since 2001 could melt an area 800km by 800km of 1m thick ice Extra freshwater since 2001 is about ¼ of annual mean river run off BS heat flux is ~ 1/5 of Fram Strait heat flux Alaskan Coastal Current (ACC) carries ~ 10% of all freshwater entering the Arctic! ~ 1/4 Bering Strait FW ~ 1/3 Bering Strait heat STILL not properly measured Transport change significant 0.7 Sv in 2001 1 Sv in 2005 2004 largest heat flux observed Increasing flow accounts for 80% of the freshwater and 50% of the heat flux increases Woodgate et al, 2006
Most recent change? NOT a continuation of the 2004 warming But what about 2007?
2006 2004 2007 2005 Temperature (degC) Mooring dataand SST(MODIS and AVHRR) 2007 from Satellites? Sea surface height and temperature data suggest 2007 heat flux will be very high (Mizobata et al, submitted) Modeling results suggest increased volume and heat fluxes in 2007, with impact on Arctic sea-ice (Zhang et al, submitted) Moorings to be recovered in early October 2008
20% 50% The role of Pacific waters in the Arctic - SIGNIFICANT amount of heat - TRIGGER for ice-albedo feedback - CONDUIT for local heat (as low density) - PAN-WESTERN-ARCTIC subsurface Temperature source Sea ice concentration from SSMI (IABP) Implicated in the seasonal melt-back of ice In summer, Pacific waters are a source of near-surface heat to the Arctic (Paquette & Bourke, 1981; Ahlnäs & Garrison, 1984)
WHY CARE? - 1/3rd of Arctic Freshwater - large % Arctic oceanic heat - most nutrient-rich inflow Local and global effects on ice, climate and ecosystems Significant interannual change STATUS NOW? - Moorings since 1990, (EEZ, ice, stratification issues) - High resolution array 2007-2009 by NSF/NOAA. - Monitoring scheme design Future for Bering Strait? NEXT? NSF/NOAA proposal for completing design Arctic Observing Network and operational monitoring scheme – insitu and satellite? psc.apl.washington.edu/BeringStrait.html Little Diomede Island, Bering Strait
Using MODIS to constrain the ACC(with Ron Lindsay) For - sea surface temperature (SST) - width of ACC - timing of ACC And thus heat flux, and maybe FW flux Black lines: weekly averages of eastern channel SST from MODIS
Long-term moorings in Bering Strait From 1990 to present T, S and velocity at 9m above bottom A1 = western Channel A2 = eastern Channel A3 = combination of A1/2 A3’ (up north) A4 = Alaskan Coastal Current Not all moorings are deployed all years! Sea Surface Temperature 26th August 2004, from MODIS/Aqua level 1 courtesy of Ocean Color Data Processing Archive, NASA/Goddard Space Flight Center, thanks to Mike Schmidt Grey arrow marks the Diomede Islands (Little and Big Diomede). Russian EEZ line passes between the islands.
Moorings in Bering Strait Short (~20 m) long bottom moored Top float at ~40 m or deeper to avoid ice keels and barges STANDARD MEASUREMENTS = Temperature and salinity and velocity at 9 m above bottom (SBE16, and Aanderaa RCM7 and RCM9/11 due to biofouling) EXTRA MEASUREMENTS = ADCP - water velocity in 2 m bins from ~15 m above bottom to near surface - ice motion and rough ice thickness = ULS – upward looking sonars (good ice thickness) = NAS – Nutrient sampler = SBE16+ - Fluorescence, transmissivity, and PAR
CTD cruises e.g. Bering Strait & Chukchi Sea 2003 5-7 day Physical Oceanography Cruise - CTD and ship’s ADCP sections - sampling nutrients, O18, (productivity, CDOM, ...) - underway data and ship’s ADCP R/V Alpha Helix Seward. AK Photo from akbrian.net
5th Sept 2004 1st Sept 2004 Bering Strait 2004 Moorings and CTD work show temperature, salinity and velocity structure changes rapidly and on small space scales. To resolve the physics, we use: - high spatial resolution (here ~ 3km) - high temporal resolution (line run in ~4 hrs) - ship’s ADCP data
Getting the 4-dimensional pictureBering Strait and Chukchi Sea 2003 23rd June 2003 Convention line Fluorescence Chlorophyll from SeaWifs Satellite from NASA/Goddard Space Flight Center & Orbimage Sea surface temperature and altimeter satellite data too 5th – 7th July 2003
Bering Strait Basics • - annual mean flow ~0.8 Sv northwards, with an annual (monthly mean) cycle of 0.3 to 1.3 Sv • - weekly flow reversals common (-2 Sv to +3 Sv) • 1 hourly flow can be over 100 cm/s • Alaskan Coastal Current (ACC) velocities can be 50-100 cm/s stronger than midchannel flow • - flow strongly rectilinear • - tides are weak • (Roach et al, 1995; Woodgate et al, 2005) - away from boundary currents, flow dominantly barotropic (Roach et al, 1995) - flow in east and west channel highly correlated (0.95, Woodgate et al, 2005, DSR)
- across-strait atmospheric pressure gradient (Coachman & Aagaard, 1981) - local wind (Aagaard et al, 1985 and others) - set-up against topography (same ref) Wind explains ca. 60 % of the variance and the seasonal cycle (Roach et al, 95) 10-6 sea surface slope gives rise to pressure gradient between Pacific and Arctic Oceans (Coachman & Aagaard, 1966; Stigebrandt, 1984) But WHY? - freshwater transport from Atlantic by atmosphere? - steric height difference? - global winds? (Nof) ASSUMED constant - but why should it be? (Woodgate et al, 2005 DSR) In the mean, the winds oppose the pressure head forcing. Thus, in winter, when winds are strongest, the northward flow is weakest. Woodgate et al, 2005 AUG APRIL What Drives the Bering Strait Throughflow? Velocity = “Pacific-Arctic Pressure Head” + “Wind Effects” Mean=northward Mean=northward Mean=southward
Reconstructing the velocity field(e.g. Woodgate et al, 2005 GRL) Assume Flow = “Pressure head” + const x (Wind) (Colours = real data; black=reconstruction) Reconstruction generally good but tends to miss extreme flow events, especially summer 1994. Linear fit to the wind better than a “climatology” But still we don’t really know the mechanism
Along the Chukchi Shelf, upwelling and diapycnal mixing of lower halocline waters and Pacific waters (Note ventilation by polynya waters couldn’t give this T-S structure) Pacific Nutrient Max Atl Pac Woodgate et al, 2005 Influence of shelf waters Use silicate to track Pacific Water in the Chukchi Borderland
P-E Bering Strait and Arctic Freshwater Aagaard & Carmack, 1989 (AC89) BERING STRAIT ~ 0.8 Sv (moorings) ~32.5 psu (summer 1960s/70s) Freshwater Flux relative to 34.8 psu ~ 1670 km3/yr OTHER INPUTS Runoff = 3300 km3/yr P-E = 900 km3/yr + ... OTHER OUTPUTS Fram Strait water = 820 km3/yr Fram Strait ice = 2790 km3/yr Canadian Archipelago = 920 km3/yr + ...
The Alaskan Coastal Current (ACC) Summer Observations 10km wide, 40m deep, wedge-shapeSummer ACC Volume flux 0.2 Sv (cf Bering Strait annual 0.8 Sv, weekly -2 to +3 Sv) Estimate salinity at 30 psu Summer ACC Freshwater flux 0.03 Sv (~900 km3/yr) But only present ca. April - December Sea Surface Temperature 26th August 2004, from MODIS/Aqua level 1, courtesy of Ocean Color Data Processing Archive, NASA/Goddard Space Flight Center, thanks to Mike Schmidt Salinity July 2003 from the Diomede Islands (left) to the Alaskan Coast (right)
The Alaskan Coastal Current July 2002-2003 VELOCITY NORTH A2 bottom central eastern channel 47m A4 the Alaskan Coastal Current 34m, 24m,14m SALINITY A2 bottom central eastern channel 48m A4 the Alaskan Coastal Current 39m Black solid line = temperatures at freezing ACC annual mean velocity 40 cm/s; transport 0.08 Sv, salinity 30.3 psu Annual Mean Freshwater Flux 220-450 km3/yr (~ 20% AC89 Bering Strait) surface currents ~ 170 cm/s (at depth 70 cm/s) across-strait salinity gradient of ~ 3 psu present until late December 2002 (JD365), returns late April 2003 (JD480)
Put it together (with stratification and ice) Summer Stratification Chukchi~ 2 layer system, with salinity step of ~ 1 psu Assume stratified 6 months, ~350 km3/yr Ice Transport - annual mean NORTHWARD ice flux of130 ± 90 km3/yr (despite almost 2 months of net southward ice flux) Salinity July 2003 from Little Diomede (left) to the Alaskan Coast (right) Total ~ 400 km3/yr (~20% of AC89 estimate) Annual Mean Freshwater flux = Previous estimate AC89 1670 km3/yr + ~ 400 km3/yr (Alaskan Coastal Current) + ~ 400 km3/yr (stratification and ice) ~ 2500 ± 300 km3/yr (Woodgate & Aagaard, GRL, 2005)
The Bering Strait Freshwater Flux(Woodgate & Aagaard, 2005) S = near bottom annual mean salinity FW = freshwater flux assuming no horizontal or vertical stratification FW+ = revised flux, including estimate of Alaskan Coastal Current and seasonal stratification Interannual variability (from near bottom measurements) smaller than errors, although possible freshening since 2003-2004 Annual Mean Freshwater Flux ~ 2500 ± 300 km3/yr including ~ 400 km3/yr (Alaskan Coastal Current) ~ 400 km3/yr (stratification and ice) ~ 1/3rd of Arctic Freshwater Arctic Rivers ~ 3300 km3/yr P-E ~ 900 km3/yr Fram Strait water & ice ~ 820 km3/yr & ~ 2790 km3/yr Canadian Archipelago ~ 920 km3/yr
Arctic Freshwater revisedSerreze et al, JGR, in press INFLOW - Rivers 38% - Bering Strait 30% - P-E 24% OUTFLOW - CAA 35% - Fram St water 26% - Fram St ice 25%
COORDINATION AND INTEGRATION The Pacific Gateway to the Arctic http://psc.apl.washington.edu/BeringStrait.html WITHOUTACC/Stratification
Bering Strait Future Plans Moorings and CTD work - NSF/NOAA proposal - US, Russian and Canadian work Altimeter and Satellite data - continue time-series measurements through and beyond IPY - improve vertical and horizontal moored resolution (especially for freshwater flux) - develop flow-proxies from wind/model/insitu/satellite data - design a monitoring network for the Bering Strait
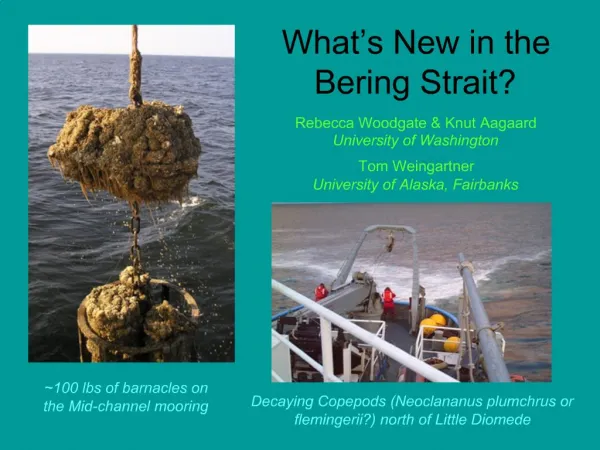
IS full of surprises North of the Diomedes, Sept 2004, large area of dead copepods A trifloat after 14 months in the water http://psc.apl.washington.edu/AlphaHelix2004.html
3 2 ICE 1 4 The Pacific Arctic Gateway http://psc.apl.washington.edu/BeringStrait.html SEASONAL VARIABILITY – significant in T,S and volume INTERANNUAL VARIABILITY - very influenced by local wind - warming and freshening since 2001 - important part of Arctic FW and heat fluxes FUTURE PLANS - heat flux with satellite data - intensive IPY array with upper layer TS measurements
NEW from this year’s data? ACC colder in 2005, but bottom waters warmer 2006 is not starting out colder even though the ice is unusually heavy