Download
1 / 18
180 likes | 347 Views
Colorado River Basin Water Supply and Demand Study NIDIS update February 24, 2011 Boulder , CO. Colorado River Basin Water Supply and Demand Study. Two-year, $2 million study cost shared by Reclamation and the Basin States Assess future water supply and demand imbalance

E N D
Colorado River Basin Water Supply and Demand Study NIDIS update February 24, 2011 Boulder, CO
Colorado River Basin Water Supply and Demand Study • Two-year, $2 million study cost shared by Reclamation and the Basin States • Assess future water supply and demand imbalance • Assess risks to all basin resources • Investigate options and strategies to mitigate impacts • A transparent, collaborative study with input from all stakeholders • Email: • ColoradoRiverBasinStudy@usbr.gov • Website: • http://www.usbr.gov/lc/region/ • programs/ crbstudy.html
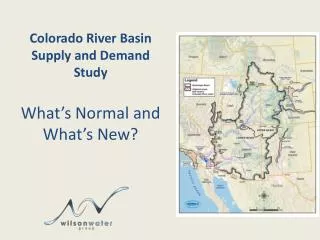
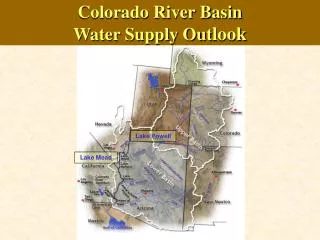
Study Area Colorado River Basin and those adjacent areas of the Basin States that receive Colorado River water Cost-Share Partners Arizona Department of Water Resources (California) Six Agency Committee Colorado Water Conservation Boar New Mexico Interstate Stream Commission Southern Nevada Water Authority Utah Division of Water Resources Wyoming State Engineer’s Office Reclamation (LC and UC Regions) Colorado River Basin Water Supply and Demand Study
Study Phases and Tasks Phase 1:Water Supply Phase 2:Water Demand Assessment Phase 3:System Reliability Analysis Phase 4:Development & Evaluation of Opportunities 1.1 – Select Methods to Estimate Current Supply 2.1 – Select Methods to Estimate Current Demand 3.1 – Identify Reliability Metrics 4.1 – Develop Opportunities 3.2 – Estimate Baseline System Reliability Formulate Approach to Include Uncertainty 1.2 – Select Methods to Project Future Supply 2.2 – Select Methods to Project Future Demand 4.2 – Evaluate and Refine Opportunities 3.3 – Project Future System Reliability 1.3 – Conduct Assessment of Current Supply 2.3 – Conduct Assessment of Current Demand Develop Future Supply and Demand Scenarios 3.3.5-3.3.8 – Project Future Reliability with Opportunities 1.4 – Conduct Assessment of Future Supply 4.3 – Finalize Opportunities 2.4 – Conduct Assessment of Future Demand
Draft Water Supply Storyline Themes • Observed (O) • Theme: Historic instrumental period for streamflow represents suitable trends and variability for characterizing the future • Direct Paleo (DP) • Theme: Paleoclimate period offers a more expansive understanding of streamflow variability that may be more representative of future variability • Paleo Conditioned (PC) • Theme: Inter-annual variability of paleo reconstructions is believed to be more representative of future variability, but streamflow magnitudes are believed to best represented by the instrumental period • Climate Projection (CP) • Theme: Future climate and streamflow variability is represented through global climate models and simulated hydrologic conditions driven by the results of these models
Global Climate Models Emission Scenarios (3 scenarios: A2, A1b, B1) Methodology for Incorporating Climate Projections in Future Supply Hydrologic Modeling (112 downscaled projections) 16 GCMs Systems Modeling (112 traces) Bias Correction & Spatial Downscaling (112 downscaled projections)
Current “Best” Estimate Natural Flow Conditions at Lees Ferry 2011 – 2060 Period Mean Annual Flows Box represents 25th – 75th percentile, whiskers represent min and max, and triangle represents mean of all traces 1988 – 2007 period mean DRAFT – SUBJECT TO CHANGE
Draft Demand Storyline Themes • “A”: Current Trends • Theme: Growth, development patterns, and institutions continue along recent trends • “B”: Economic Slowdown • Theme: Low growth with emphasis on economic efficiency • “C”: Expansive Growth • Theme: Economic resurgence driven by population growth and energy needs • C1 branch to slower technology adoption • C2 branch to rapid technology adoption and slight increase in social values • “D”: Enhanced Environment and Healthy Economy • Theme: Expanded environmental awareness and stewardship with growing economy • D1 branch to current growth trends • D2 branch to higher growth and technology
Integration of Supply and Demand Scenarios Demand Scenarios Supply Scenarios (multiple realizations for each scenario) PR D Recent Trends PC O A Current Trends B C CP Climate indexing for demands
Colorado River Simulation System (CRSS) • Comprehensive model of the Colorado River Basin • Developed by Reclamation (early 1970s) and implemented in RiverWareTM (1996) • Primary tool for analyzing future river and reservoir conditions in planning context (NEPA EIS) • A projection model, not a predictive model • Excellent for comparative analysis • Gives a range of potential future system conditions (e.g., reservoir elevations, releases, energy generation) • Simulates on a monthly timestep over decades • Operating policy is represented by “rules” that drive the simulation and mimic how the system operates
Metrics are measures that indicate the ability of the system to meet the needs of Basin resources Metrics will be used to quantify the impacts to Basin resources from future supply and demand imbalances System Reliability Metrics • Metrics Resource Categories • Depletions • Electrical Power Resources • Water Quality • Flood Control • Recreational Resources • Ecological Resources
Study Phases and Tasks Phase 1:Water Supply Phase 2:Water Demand Assessment Phase 3:System Reliability Analysis Phase 4:Development & Evaluation of Opportunities 1.1 – Select Methods to Estimate Current Supply 2.1 – Select Methods to Estimate Current Demand 3.1 – Identify Reliability Metrics 4.1 – Develop Opportunities 3.2 – Estimate Baseline System Reliability Formulate Approach to Include Uncertainty 1.2 – Select Methods to Project Future Supply 2.2 – Select Methods to Project Future Demand 4.2 – Evaluate and Refine Opportunities 3.3 – Project Future System Reliability 1.3 – Conduct Assessment of Current Supply 2.3 – Conduct Assessment of Current Demand Develop Future Supply and Demand Scenarios 3.3.5-3.3.8 – Project Future Reliability with Opportunities 1.4 – Conduct Assessment of Future Supply 4.3 – Finalize Opportunities 2.4 – Conduct Assessment of Future Demand
Colorado River Basin Water Supply and Demand Study http://www.usbr.gov/lc/region/programs/crbstudy.html NIDIS update February 24, 2011 Boulder, CO
Graphical Depiction of Driving Forces Categories and Scenarios D2 D1 Social & Institutional Economics & Technology A C2 B C1 Today Demographics & Land Use
Categorization and Selected Driving Forces for Storyline Development