Download
1 / 34
340 likes | 499 Views
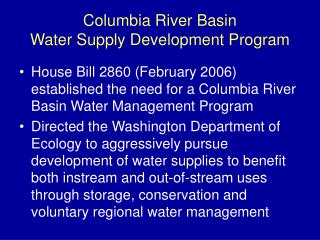
Upper Colorado River Basin WY 2011 Water Supply Forecast Verification. CBRFC 2011 Stakeholder Forum November 3, 2011. Green River Basin. Upper Green. Slightly above normal seasonal precipitation through March 2011 Sustained cool and wet period April-June

E N D
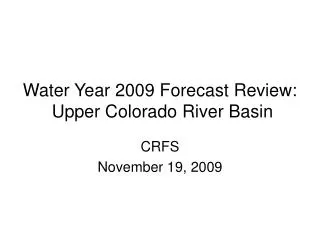
Upper Colorado River BasinWY 2011 Water Supply Forecast Verification CBRFC 2011 Stakeholder Forum November 3, 2011
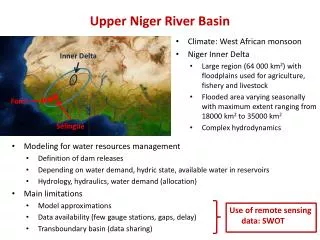
Green River Basin Upper Green • Slightly above normal seasonal precipitation through March 2011 • Sustained cool and wet period April-June • Runoff delayed (especially to the north and west) • Many record or near records for precipitation, runoff volumes, etc Yampa Duchesne
Upper GreenBasin Conditions 160 % 120 % 115 % • Two new records for April-July volume at points coming off the north slope of the Uintas.
1926 162%
DuchesneBasin Conditions 145 % 215 % • 10/16 forecast points set records for April-July volume.
158 268%
YampaBasin Conditions • Record Snowpack • All forecast points set records for April-July volume.
1988 201%
881 241%
Elk River nr Milner…….the Record Breaker!! Record (42 yr) Volume: 742 KAF Old Record : 552 KAF Record Snow Record (42yr) Peak: 7110 cfs
Green River Basin Records RED=Single Month Volume > April-July Average *POR after regulation White/Yampa=10 /10 Duchesne=10/16
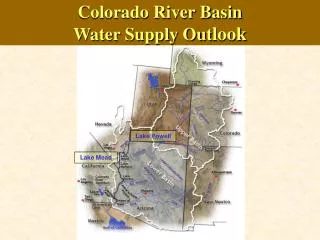
Upper Colorado Basin • Slightly above normal seasonal precipitation through March 2011 • Sustained cool and wet period April-June • Many record or near records for precipitation, runoff volumes, etc • Precipitation and runoff volumes greater to the north (e.g. Granby, Dillon, etc) and less to the south (e.g. Gunnison) and still less in the Dolores Mainstem Gunnison Dolores
Upper Colorado MainstemBasin Conditions As of July 1, 2011 As of August 1, 2011
428 190% Record Runoff 343 (1984) 225
276 (1984) 268 161% 167
577 172% 4489 (1984) 4200 174% 2420 1026 145%
893 124%
275 86%
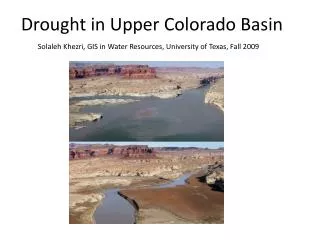
San Juan Basin • Near to Below normal year • Evidence of La Nina
579 75%
431 98%
Historical Observed Apr-Jul Volumes (kaf) 1970-2010 (winter ENSO status) ( 1) - 1984 - 15406.41 (neutral) ( 2) - 1983 - 14838.93 (el nino) ( 3) - 1986 - 12601.21 (neutral) ( 4) - 1995 - 11833.18 (el nino) ( 5) - 1985 - 11701.11 (la nina) ( 6) - 1997 - 11320.89 (neutral) ( 7) - 1973 - 11262.74 (el nino) ( 8) - 1979 - 11104.25 (neutral) ( 9) - 1980 - 10606.60 (neutral) ( 10) - 1993 - 9984.42 (neutral) ( 11) - 1975 - 9953.16 (la nina 2) ( 12) - 2008 - 8908.50 (la nina) ( 13) - 2005 - 8844.02 (el nino) ( 14) - 1978 - 8678.09 (el nino 2) ( 15) - 1998 - 8510.14 (el nino) ( 16) - 1982 - 8210.63 (neutral) ( 17) - 1971 - 8180.35 (la nina) ( 18) - 1970 - 8037.76 (neutral) ( 19) - 2009 - 7806.72 (neutral) ( 20) - 1999 - 7788.09 (la nina) ( 21) - 1987 - 7758.54 (el nino) ( 22) - 1996 - 7233.47 (la nina) ( 23) - 1974 - 6915.13 (la nina) ( 24) - 2010 - 5795.43 (el nino) ( 25) - 1972 - 5494.26 (neutral) ( 26) - 2006 - 5319.56 (neutral) ( 27) - 1976 - 5297.75 (la nina 3) ( 28) - 1991 - 5159.33 (el nino) ( 29) - 1988 - 4567.47 (el nino 2) ( 30) - 2000 - 4367.05 (la nina 2) ( 31) - 2001 - 4320.62 (la nina 3) ( 32) - 1992 - 4124.42 (neutral) ( 33) - 2007 - 4053.47 (el nino) ( 34) - 2003 - 3910.17 (el nino) ( 35) - 1994 - 3766.48 (neutral) ( 36) - 2004 - 3542.00 (neutral) ( 37) - 1989 - 3524.63 (la nina) ( 38) - 1990 - 3228.85 (neutral) ( 39) - 1981 - 3058.61 (neutral) ( 40) - 1977 - 1277.39 (el nino) ( 41) - 2002 - 1126.76 (neutral) Lake Powell 2011 – 12,920 (la nina) 3rd highest April-July volume since the closure of the dam
15.7 (1917) 12.9 maf 163% 7.9
6490 205% 12.9 163% 6894 148% 888 72%
Lower Colorado Basin • Much below average except in northwest (e.g. Virgin, Muddy, etc) • Virgin: • December 2010 storm track was important, but also wet April-May. • Snowpack persisted due to cool temperatures; melt delayed. Virgin Phoenix dust storm
149 217%
2011 Summary • Extremely wet in the north and dry in the south – dryness in the south was consistent with La Nina. • Volume forecasts generally started too low in the north and too high in the south. • Extremes are difficult to predict but many forecasts this year were for extremes.