Download
1 / 32
320 likes | 607 Views
The Role of Intelligence in Mobility & The Bell Curve Controversy. M. Cohen, B. Talekar, V. Wang SOCI230 Spring 2004 29 March. OUTLINE. What is intelligence? How is it measured? Bases for Intelligence Correlates of Intelligence (largely with respect to ethnicity)

E N D
The Role of Intelligence in Mobility & The Bell Curve Controversy M. Cohen, B. Talekar, V. Wang SOCI230 Spring 2004 29 March
OUTLINE • What is intelligence? • How is it measured? • Bases for Intelligence • Correlates of Intelligence (largely with respect to ethnicity) • Responses and Critiques • Implications of theories and research?
WHAT IS INTELLIGENCE? The study of variation in intelligence across different population groups became a subject of study in the last half of the nineteenth century • The classicists (intelligence as a structure) – “The Bell Curve” • The revisionists (intelligence as information processing) • The radicals (the theory of multiple intelligences)
WHAT IS INTELLIGENCE? • Galton – correlation coefficient (1888) • Spearman – g & s factors (Two factor theory of intelligence) • Binet - age-graded tests • Thomson – different conceptualization of g • Thurstone – refuted the g factor; separate intellectual abilities unrelated to each other “The effort to dislodge g has been less than successful”
HOW IS INTELLIGENCE MEASURED? Concepts • Psychometric approach (“Cognitive classes”) • Multiple forms of intelligence (e.g., Gardner, Sternberg) • Cultural variation in concepts of intelligence • Developmental progressions (e.g., Vygotsky, Piaget) • Biological approaches
HOW IS INTELLIGENCE MEASURED? • Numerous attempts to measure it have been discounted – acts of racism, political reaction, political bungling, and scholarly fraud. • Timed tests that measure speed of cognitive tasks • Choice reaction time • Inspection time • Neurological measures • Problems of interpretation, unanswered questions
BASIS FOR INTELLIGENCE: Genetics • Behavior genetics (misnomer) • study of the genetic and environmental influences on a trait • understand the sources of variation in a phenotypic characteristic - score on an intelligence test • Research on twins and families to understand the genetic and environmental influences on development and change in intelligence
BASIS FOR INTELLIGENCE: Genetics • Studies on twins • MZ twins genetically identical • DZ twins no more similar to each other than siblings • Conceptual and empirical problems in studying twins • Studies • Twins reared together and apart • Separated MZ twins encounter more varied environments than MZ and DZ twin pairs reared together – yet they are somewhat more alike in IQ than DZ twins reared in the same family
BASIS FOR INTELLIGENCE: Family environment • Studies of the relationship between IQ scores of adopted children and their biological and adopted parents • Danish fathers (Teasdale & Owen, 1984) • Texas Adoption Study (Horn, Loehlin & Willerman, 1979) • The Colorado Adoption Project (Plomin & DeFries, 1985)
BASIS FOR INTELLIGENCE: Family environment • The biological background of adopted children influences the IQ of these children • The biological background of the adopted child more important in determining the IQ of the older child than the characteristics of the adoptive families
BASIS FOR INTELLIGENCE: Family environment Conclusions: • The heritability of IQ increases with age from infancy to adulthood • Between family environmental influences decline with age – they are hardly detectable over wide ranges of the environment for adult samples • Phenotypic continuity on IQ is substantially influenced by genetic continuity • Genetic influences on IQ not expressed at an earlier age may influence IQ at a later age • Genotype X environment interactions are not an important source of influence on the development of IQ
BASIS FOR INTELLIGENCE: Social environment • Is it possible to increase cognitive ability? • Nutrition: may be linked, but not well understood • Special programs (i.e., Head Start): only minor/temporary effects • Other known factors • Culture: Corr (ethnicity, IQ) falls to ~0 when accounting for sociocultural factors • Improvements in the economic circumstances, in the quality of the schools attended, in better public health and perhaps also in diminishing racism may be narrowing the gap (H&M, p. 270, 292) …but the authors don’t seem convinced. • Attempts to raise intelligence – by altering the social and physical environment – is one of high hopes, flamboyant claims, and disappointing results…the problems of low cognitive ability are not going to be solved by outside interventions (p.387,389).
CORRELATES OF INTELLIGENCE: Gender Brody • Gender differences in intellectual ability are small to virtually non-existent • Secular changes are attributed to narrowing the gender gap in special ability scores, with an implication that secular changes in culture may have something to do with this (i.e., sex stereotyping of activities, curricular choices)
CORRELATES OF INTELLIGENCE: Ethnicity & Race • Brody presents studies with conflicting results, and concludes that we know little about reasons for the differences in IQ, but reasons may be found in distinctive cultural experiences. • H&M: Ethnic differences in cognitive ability are real • In terms of IQ score, the trend is generally: East Asian > White > Black • Refuting evidences of bias: • Predictability of tests – no systematic differences found • Tests’ cultural bias (B/W difference is wider on items that appear to be culturally neutral than on items that are culturally loaded). • Ethnic differences in higher education, occupations, and wages are significantly diminished after controlling for IQ
CORRELATES OF INTELLIGENCE: SES • Posit: Part of what appears to be an ethnic difference in IQ scores is actually a socioeconomic difference. • H&M find that size of the B/W gap shrinks when socioeconomic status controlled for • SES explains 37% of original B/W differences • IQ scores increase with SES for both races, however, the magnitude std devs of the B/W differences remain roughly the same (p. 288) • SES may also be considered a result of cognitive ability
CORRELATES OF INTELLIGENCE: Education • Intelligence found to be related to academic performance and number of years of education (Brody) • H&M: After controlling for IQ…larger numbers of blacks than whites graduate from college • Chances of a 29 y.o. in 1990 having graduated from college with an IQ of 114 =49% (Latino) =50% (White) =68% (Black) • These findings run counter to affirmative action’s assumption that ethnic groups do not differ in the abilities that contribute to success in school and workplace (p. 449).
CORRELATES OF INTELLIGENCE: Occupation & Wages • Individuals with low IQ are not likely to be found in high-status occupations that require high levels of formal education as a condition for entry into the occupation • Individuals with high intelligence are more likely to attain an occupational status higher than that of their parents (than those who are low in intelligence) (Brody) • If selection by cognitive ability scores were strictly race blind...blacks are overrepresented in most occupations, especially in high-status occupations (medicine, engineering, teaching) • Roughly 6 times as many blacks in teaching and medicine • Over 90% of raw black- and Latino-white wage differentials disappear after controlling for IQ • Conclusion: IQ score is more important in explaining B/W occupation and wage differences than are education and SES for most occupational categories
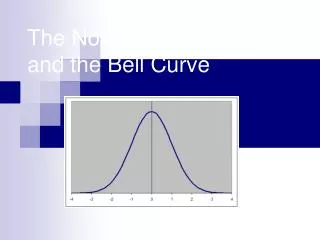
CORRELATES OF INTELLIGENCE: Social problems The worst social problems are heavily concentrated in the lower portion of the curve.
Herrnstein & Murray’s prescription for change… • Education: Current measures of success are intended for average to below-average students, letting the gifted get away without ever developing their potential • Solution: Fund reallocation to decrease funds focused on the disadvantaged and increase budget for gifted programs • Affirmative action: The manner in which it is currently practiced has lost touch with any reasonable understanding of the logic and purposes of affirmative action (p. 468) • Issue relates to the difference between “ethnic equity” and “competitive fairness” • Affirm action fosters differences in the distribution of academic ability across races on college campuses • After controlling for IQ, it’s difficult to demonstrate that the US still suffers from racial discrimination in occupations and pay • Solution: abolish its use in college admissions and in the workplace.
Herrnstein & Murray’s predictions for future • Old stratifications are fading, replaced by a greater reliance on “merit”. Hence, the rise of the “cognitive elite” – a status acquired via high IQ (implying that social background, ethnicity, and money would serve as obstacles toward its attainment). • The rich vs. the intellectuals: the affluent will constitute a major portion of the population and they will increasingly consist of the most talented population (p. 517). • The underclass: Out-migration of the cognitively best individuals out of lower class neighborhoods and settings. This will exacerbate the conditions of the underclass. The cognitive elite will come to consider the underclass as in their condition through no fault of their own, but due to inherent shortcomings about which little can done. Because the underclass cannot be trusted to make wise decisions for themselves (i.e., to use cash wisely), the cognitive elite will develop social welfare policies primarily in the form of services rather than cash…policies of custodialism. This has implications on the socio-demographic make-up of communities, state and federal budgets, centralization of governance. The population of the underclass will continue to grow. Racial tensions will re-emerge.
Cracking the Bell Curve Myth: An overview “Americans have created the extent and type of inequality we have, and Americans maintain it” (p.7) • Inequalities among Americans are not inevitable • Inequality is a social construction; not solely determined by genetic endowments
Cracking the Bell Curve Myth: The problem with psychometrics Psychometrics – main assumptions • The fundamental skill critical to human functioning is “intelligence” • General intelligence (g) is “a general capacity for inferring and applying relationships” • People must rank in a bell curve
Cracking the Bell Curve Myth:Information-processing approach Intelligence “…is mental self-management” (p.47) [quote from Robert Sternberg] • Intelligence can be taught and trained • Measurement tools test intellectual process • New research tests everyday problem solving • Adds new insights to psychometrics
Cracking the Bell Curve Myth: What do IQ tests measure? “Intelligence is what intelligence tests measure” (p.27) [quote from Arthur Jensen] • “Screw-up” attitudes and luck • Exposure to curricula, not intelligence • Tests are limited in their ability to predict how people apply their knowledge in practical situations
Cracking the Bell Curve Myth:Reanalysis of the NLSY data • Bell Curve errors in the analysis • Missing information • Unreliable parental SES scale • Inappropriately weighted parental SES variables • Omitted variable bias • Corrected findings • Parental home environment, community context, educational attainment, and gender are more accurate predictors of poverty than nature
Cracking the Bell Curve Myth:Systems of inequality “America’s level of inequality is by design. It is not by nature, nor by the distribution of its people’s talents, nor by the demands of the Western market.” (p.125) • Between WWII and 1970 inequality decreased, then widened in the early 1970s and through the 1980s • These changes cannot be explained by individual inherited characteristics (e.g., intelligence) • U.S. has greater degree of income inequality than any other developed nation, but inequality is not necessary for economic growth
Cracking the Bell Curve Myth:America’s policy choices • Policies to reduce poverty • AFDC, school lunches, food stamps, etc. • Most successful among elderly, while many children are left poor • Americans less supportive of such programs than citizens of other affluent nations • Subsidizing the middle class • Health care, tax deductions for families, subsidizing homeownership
Cracking the Bell Curve Myth:America’s policy choices, cont’d. • Subsidizing the wealthy • Corporate welfare, tax laws • Regulating the labor market • Union rules, plant relocation, wage setting • Enriching intelligence • Quality of schooling affects rates of learning • Biased track placement in schools • Summer vacations • Job structure affects adult development
Cracking the Bell Curve Myth:Race, ethnicity, and intelligence “A racial or ethnic group’s position in society determines its measured intelligence rather than vice versa.” (p.173) • Koreans in Japan; Polish Jews in 1920s US • History matters: Africans and Mexicans in US • Inequality and discrimination continue today
Cracking the Bell Curve Myth:Subordination & low performance • Socioeconomic deprivation • Segregation concentrates and accentuates disadvantages • Stigma of inferiority prompts attitudes of resignation and rebellion
IMPLICATIONS/DISCUSSION • Of the various social outcomes and behaviors analyzed, which ones present the case for a strong causal role of IQ and which ones present weak cases? • Is equality a utopian ideal in the US? What kind of equality are we talking about here? • With regard to finding valued places/position in society according to intelligence, is there a link between Herrnstein & Murray’s work and Parsons? • What are the methodological barriers to testing the theoretical frameworks introduced in the readings? • Are there other (mediating) factors related to intelligence, differences in ethnicity, and social strata that this week’s authors discounted or failed to acknowledge? • Implications of works on social policies of today and the future?
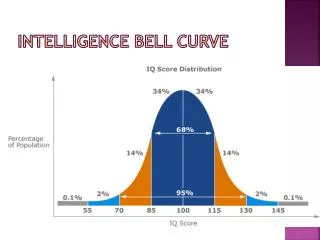
Mainstream Science on Intelligence (Gottfredson,1994) • Intelligence is a very general mental capability; not merely book learning (1) • Intelligence can be, and is, measured well (2) • The spread of people along the IQ continuum can be represented well by the bell curve (4) • Intelligence tests are not culturally biased (5) • IQ is probably more strongly related to individual outcomes than any other single trait (9) • Individuals differ in intelligence due to both their environments and genetic heritage, but genetics plays a bigger role (14) • IQ’s gradually stabilize during childhood (16)