Download
1 / 15
200 likes | 352 Views
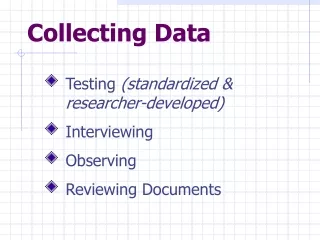
Collecting Data. Chapter 1 Lesson 6. Think about it…. Is there anything you would like to ask the rest of the eighth-graders at Indian Crest in a survey?

E N D
Collecting Data Chapter 1 Lesson 6
Think about it… • Is there anything you would like to ask the rest of the eighth-graders at Indian Crest in a survey? • How would you go about surveying eighth-graders at Indian Crest? Would you survey every eighth grader? What are the pros and cons of surveying everyone? Would you only ask some of the students? How would you decide who to survey?
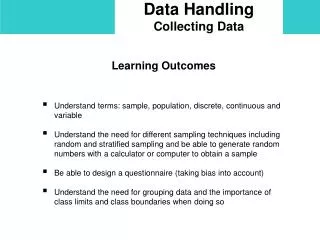
Key Terms • Sample: a small group used to represent a population. • Population: a large group of data
What makes a good sample? • 1. Selected at random • 2. Representative of the population • 3. A large enough number to provide accurate data
Is this a good sample? • One hundred people in Lafayette, Colorado were asked to eat a bowl of oatmeal every day for a month to see whether eating a healthy breakfast daily could help reduce cholesterol. After 30 days, 98 of those in the sample had lower cholesterol. Is this a good sample?
GOOD SAMPLES? • Two hundred students at a school basketball game are surveyed to find the students’ favorite sport. • No, more students will say basketball. • Every other person leaving a supermarket is asked to name their favorite soap to determine the average shopper’s favorite soap. • Yes, it is random and representative.
Survey of Indian Crest Students • You want to know the average amount of time students at Indian Crest and Indian Valley spend on homework per night. • What would be a good sample to gather data about this topic through a survey? • Give an example of a sample that would not be a good way to gather this information through a survey.
Frequency Tables • After you complete a survey, the data you gather needs to be organized. One way to organize your data is in a frequency table. • In a frequency table, you use tally marks to record and display the frequency of events.
How to Make a Frequency Table • Make a table with three columns: Time, Tally and Frequency. Add a Title.
Step 3: Use tally marks to record the times in each interval.
Step 4: Count the tally marks in each row and record this number in the frequency column.
Cumulative Frequency Tables • Frequency Table Data
Journal • Explain the difference between a frequency table and a cumulative frequency table. • List some examples of how a survey might be biased.