Download
1 / 29
410 likes | 926 Views
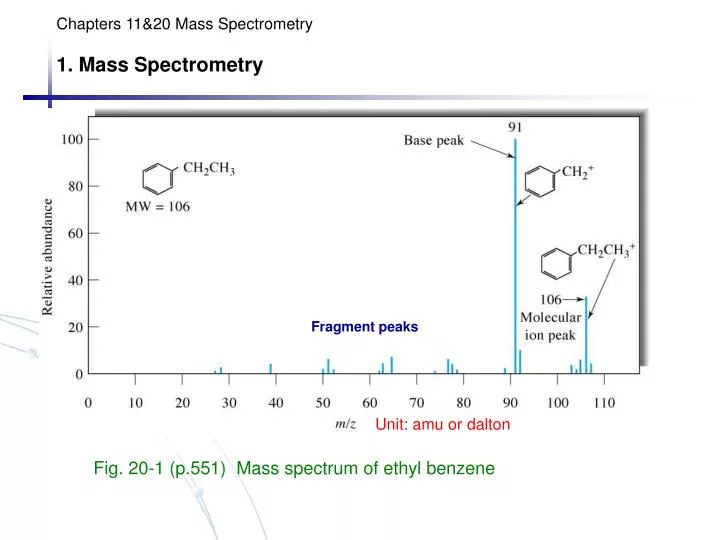
Chapters 11&20 Mass Spectrometry 1. Mass Spectrometry. Fragment peaks. Fragment peaks. Unit: amu or dalton. Fig. 20-1 (p.551) Mass spectrum of ethyl benzene. 2. Instrumentation. Sample inlet system – vaporize sample Ion source – ionizes analyte gas molecules

E N D
Chapters 11&20 Mass Spectrometry1. Mass Spectrometry Fragment peaks Fragment peaks Unit: amu or dalton Fig. 20-1 (p.551) Mass spectrum of ethyl benzene
2. Instrumentation • Sample inlet system – vaporize sample • Ion source – ionizes analyte gas molecules • Mass analyzer – separates ions according to m/z • Detector – counters ions • Vacuum system – reduces collisions between ions and gas molecules 10-5 -10-8 Fig. 20-11 (p.564) Components of a mass spectrometer
2.1 Sample inlet 2.1.1 External (Batch) inlet systems • Liquid • Gas 2.1.2 Direct probe • Non-volatile liquid • Solid Fig. 20-12 (p.564) Sample inlet
2.1.3 Chromatography/Electrophoresis - Permits separation and mass analysis • How to couple two techniques? GC/MS, Fig. 27-14 (p.799) Capillary GC-MS
HPLC/MS, nano flow, ESI Adapted from http://www.bris.ac.uk/nerclsmsf/techniques/hplcms.html
Hard ionization leaves excess energy in molecule – extensive fragmentation Soft ionization little energy in molecule – reduced fragmentation Fig. 20-2 (p.553) Mass spectrum of 1-decanol from (a) a hard ionization source (electron impact) and (b) a soft ionization (chemical ionization)
2.2.1 Gas-phase ion source (1) Electron Impact (EI) Electron bombardment of gas/vapor molecules Fig. 20-3 (p.553) An electron-impact ion source
(2) Chemical ionization (CI) • EI ionization in excess (105 of analyte pressure) of reagent gas (methane) to generate CH4+ and CH3+, then CH4+ + CH4 CH5+ + CH3 CH3+ + CH4 C2H5+ + H2 Ions reacts with analyte CH5+ + A CH4 + AH+ proton transfer C2H5+ + A C2H4 + AH+ proton transfer C2H5+ + A C2H6 + (A-H)+ hydride elimination - analyte most common ions (M+1)+ and (M-1)+ sometimes (M+17)+ addition of CH5+ or (M+29)+ (addition of C2H5+) Adapted from Schröder, E. Massenspektrometrie - Begriffe und Definitionen; Springer-Verlag: Heidelberg, 1991.
2.2.2 Desorption/Ionization sources (For non-volatile or non-stable analytes) (1) Electrospray ionization (ESI): explosion of charged droplets containing analyte - solution of analyte pumped through charged (1-5 kV) capillary - droplets become charged - solvent evaporates, drop shrinks, surface charge density increases - charge density reduced by explosion of charged analyte molecules (“Coulomb explosion”) Soft ionization – little fragmentation Easily coupled to HPLC http://www.bris.ac.uk/theory/fab-ionisation.html
Important for large (105 Da) thermally fragile molecules, e.g., peptide, proteins • produce cations or anions • may accumulate multiple charges in ESI, M2+, M3+ … • molecular mass = m/z x number of charges Fig. 20-10 (p.563) Typical ESI MS of proteins and peptides.
(2) Fast atom bombardment (FAB) - Sample in glycerol matrix - Bombarded by high energy Ar or Xe atoms ( few keV) - Atoms and ions sputtered from surface (ballistic collision) - Both M+ and M- produced - Applicable to small or large (>105 Da) unstable molecule Comparatively soft ionization – less fragmentation http://www.bris.ac.uk/theory/fab-ionisation.html
(3) Matrix-assisted laser desorption/ionization (MALDI) - analyte dispersed in UV-absorbing matrix and placed on sample plate - pulsed laser struck the sample and cause desorption of a plume of ions, - energy absorption by matrix, transfer to neutral analyte desorption of matrix and neural analyte ionization via PT between protonated matrix ions and neutral analyte Fig. 20-7 (p.560) Diagram of MALDI progress
MALDI spectrum contains: dimmer, trimmer, multiply charged molecules no fragmentation, Soft ionization Fig. 20-8 (p.561) MALDI-TOF spectrum from nicotinic acid matrix irradiated with a 266-nm laser beam.
Matrices: small MW absorb UV able to crystallize
2.3 Mass analyzer (separate ions to measure m/z and intensity) Resolution: - ability to differentiate peaks of similar mass R=mean mass two peaks / separation between peaks = (m1+m2)/2(m1-m2) • Resolution depends on mass • If R=1000, separate 1000, 1001, or 100.0, 100.1, or 10000, 10010 • High resolution necessary for exact MW determination • Nominal MW =2 8 • Actual MW C2H4+ = 28.0313 CH2N+ = 28.017 N2+ = 28.0061, R > 2570
Kinetic energy of ion: KE = zeV = 1/2m2 Magnetic force: FB = Bze Centripetal force: Fc = m2/r Only for ions with FB = FC can exit the slit m/z = B2r2e/2V For fixed radius & charge - use permanent magnet, and vary A and B potential V - Fixed V, vary B of electromagnet 2.3.1 magnetic sector analyzers Fig. 20-13 (p.567) Schematic of a magnetic sector spectrometer.
2.3.2 quadrupole analyzer Ions travel parallel to four rods Opposite pairs of rods have oppositive VRFcos(2ft) and UDC Ions try to follow alternating field in helical trajectory VRFcos(2ft) UDC Fig. 11-6 (p.283) A quadrupole mass spectrometer
VRFcos(2ft) + UDC Fig. 11-7 (p.288) operation of a quadrupole in xz plane
Stable path only for one m/z value for each field frequency UDC= 1.212mf2r02 VRF= 7.219mf2r02 UDC /VRF = 1.212/7.219 = 0.1679 R=0.126/(0.16784-UDC/VRF) • Harder to push heavy molecule – m/zmax < 2000 • Rmax ~ 500 Fig. 11-7 (p.288) Change of UDC and VRF during mass scan
2.3.3 Time-of-flight (TOF) analyzer Generate pulse of ions with same initial energy Ions travel down field-free tube separate according to m/z Fig. 11-10 (p.290) A TOF mass spectrometer
Unlimited mass range m/zmax > 100 kDa Poor resolution Rmax < 1000 Poor sensitivity
2.4 Detectors 2.4.1 Electron Multipliers Fig. 11-2 (p.284) Electron multiplier
2.4.2 Microchannel Plates (MCP) Fig. 11-4 (p.286) MCP
3. Application of MS Identification of Pure compounds • Nominal M+ peak (one m/z resolution) (or (M+1)+ or (M-1)+) give MW (not EI) • Exact m/z (fractional m/z resolution) can give stoichiometry but not structure (double-focusing instrument) • Fragment peaks give evidence for functional groups (M-15)+ peak methyl (M-18)+ OH or water (M-45)+ COOH series (M-14)+, (M-28)+, (M-42)+… sequential CH2 loss in alkanes • Isotopic peaks can indicate presence of certain atoms Cl, Br, S, Si • Isotopic ratios can suggest plausible molecules from M+, (M+1)+ and (M+2)+ peaks 13C/12C = 1.08%, 2H/1H = 0.015% (M+1) peak for ethane C2h6 should be (2x1.08) + (6x0.015)=2.25% M+ peak (f) Comparison with library spectra
What about peaks at greater m/z than M+? • Two sources • Isotope peaks –same chemical formula but different masses • 12C1H235Cl2 m=84 • 13C1H235Cl2 m=85 • 12C1H235Cl37Cl m=86 • 13C1H235Cl37Cl m=87 • 13C1H237Cl2 m=88 • Heights vary with isotope abundance 13C 1.08% 12C, 2H is 0.015% 1H, 37C is 32.5% 35C CH2Cl2, 13C, 1 x 1.08 = 1.08 37Cl, 2 x 32.5% 2H, 2 x 0.015 = 0.030% (M+1)+/M+ = 1.21% (M+2)+/M+ =65% Fig. 20-4 (p.556) EI mass spectra of methylene chloride and 1-pentanol
4. Summary One of the most powerful analytical tools Sensitive (10-6 -10-13g) Range of ion sources for different situation Element comparison for small and large MW –biomolecules Limited structural information Qualitative and quantitative analysis of mixtures Composition of solid surfaces Isotopic information in compounds But Complex instrumentation Expensive: high resolution Structure obtained indirectly Complex spectra/fragmentation for hard ionization sources Simple spectra for soft ionization sources