Download
1 / 25
270 likes | 498 Views
Why Mass Spectrometry: An Introduction to the IU MSF. Jonathan A. Karty, Ph.D. jkarty@indiana.edu http://msf.chem.indiana.edu . Why Mass Spectrometry. Information is composition-specific Very selective analytical technique

E N D
Why Mass Spectrometry: An Introduction to the IU MSF Jonathan A. Karty, Ph.D. jkarty@indiana.edu http://msf.chem.indiana.edu
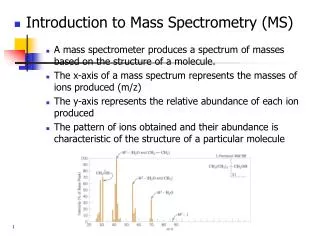
Why Mass Spectrometry • Information is composition-specific • Very selective analytical technique • Most other spectroscopies can describe functionalities, but not chemical formulae • MS is VERY sensitive • mg/L to ng/L sensitivity possible • Picomole sensitivity is common in the MSF • Mass spectrometers have become MUCH easier to use in the last 15 years
Three Questions • Did I make my compound? • Molecular weight is an intrinsic property of a substance • Did I make anything else? • Mass spectrometry is readily coupled to chromatographic techniques • How much of it did I make? • Response in the mass spectrometer is proportional to analyte concentration (R = α[M]) • Each compound has a unique response factor, α
Common MS Applications • Quick product identification (TLC spot) • Confirmation of elemental composition • Much more precise then EA • Selective detector for GC/HPLC • MS provides retention time AND molecular weight information about each analyte • Reaction monitoring • Crude reaction mixture MS • Stable isotope labeling • Stability studies
Important Concepts to Remember • Mass spectrometers analyze gas-phase ions, not neutral molecules • Neutral molecules don’t respond to electromagnetic fields • If you cannot make a stable ion, MS is impossible • MS is not a “magic bullet” technique • MS can tell you composition of an ion (CxHyOz) • Connectivity of the atoms in that ion is much more challenging • Units • 1 Da = 1 u = 1.6605*10-27 kg (1/12 of a 12C atom) • 1 Th = 1 Da/e = 1.0364*10-8 kg/C
Molecular Weight Calculations • The molecular weight is computed by summing the masses of all atoms in the compound/ion. • Erythromycin (M+H)+: C37H68N1O13+ = 12.011*37 + 1.008*67 + 14.007 + 15.999*13 = 734.93 Da • Yet 734.5 is observed by ESI-MS
Isotopic Distributions C40 mass spectrum • Isotopes: same number of protons, different numbers of neutrons • 12C has 6 of each, 13C has 6 protons and 7 neutrons • Periodic table assumes a natural distribution of stable isotopes (weighted average) • Carbon isotopes • C 12C is 98.9% abundant, 13C is 1.1% abundant • (0.989 * 12.0000) + (0.011 * 13.0034) = 12.011 • For C40: 64.2% 13C0, 28.6% 13C1, 6.2% 13C2 • Spectrum looks like 100% @ 480, 44.5% @ 481, 9.6% @ 482 • Many elements have a variety of isotopes • Sn has 7 naturally occurring isotopes • F, P, Na, I, Co, Au have only 1 natural isotope
Monoisotopic Masses • Monoisotopic masses are considered for mass spectrometry • Monoisotopic masses are computed using the most abundant isotope of each element (12C, 35Cl, 14N, 16O, 79Br, 11B, 120Sn etc) • For erythromycin, monoisotopic mass = 734.468 • 12C37 1H68 14N1 16O13 • 12.000 * 37 + 1.0078 * 68 + 14.0031 + 15.9949 * 13 • Remember to include any ionizing reagent • Electron loss, proton addition, etc.
C37H68NO13+ Mass Spectrum 13C0, 2H0, 18O0 13C1, 2H0, 18O0 13C2, 2H0, 18O0 13C0, 2H0, 18O1 13C1, 2H1, 18O0 Average mass = 734.93 u Observed isotope pattern is the convolution of isotope patterns for all atoms
Isotopic Envelopes • Isotopic distributions can indicate/preclude the presence of an element • Cl has a unique 3:1 pattern (M:M+2) • B has a unique 1:4 pattern (M-1:M) • M+1 / M+ ratio can be used to count carbon atoms in a molecule • [(M+1) / M+] / 0.011 ≈ # carbon atoms • For morphine: (0.1901 / 1) / 0.011 = 17.28 17 • Significant deviation from expected isotope pattern should be a warning sign • Multiple compounds with similar masses in sample • Partial isotopic enrichment (e.g. deuterated solvents used) • Multiple ionization mechanisms at work
Two Complex Isotope Patterns Monoisotopic mass: 370.03 Average mass: 369.96 C12H27SnBr tributyltin bromide C2H3Cl3 trichloroethane Monoisotopic mass: 131.93 Average mass: 133.43
Instrumentation in the MSF • One of 3 mass spectrometry facilities in the department • MSF is in Chemistry A411 and A454 • 1 GC-EI-Q-MS (A454) • 1 LC-ESI/APCI-Q-MS (A454) • 2 LC-ESI-TOF-MS (A411) • 1 MALDI-TOF-MS (A411) • 1 EI/CI-BE-MS (A411, staff only) • Self-run experiments are $7-$10 per sample • Staff-run experiments are $16-$30 • Training for Walk-Up MS will start after 11/7/10
Agilent 6890/5973 GC-MS • 6890 GC • 30 m long DB-5 (non-polar) column installed • Helium mobile phase • Split/splitless injector with autosampler • 5973 MS • Electron ionization • Quadrupole MS (10-800) • NIST 02 library installed
Agilent 1200/6130 LC-MS • 1200 HPLC • Binary pump • 0.05-2 mL/min • Autosampler with 6-position column selector • Diode array UV-VIS detector • 6130 MS • Dual mode electrospray/APCI source • Can perform all 4 modes of ionization in 1 experiment • 50-3,000 m/z quadrupole • Easy Access Software
Waters CapLC-LCT LC-MS • CapLC • Flow rates 1-40 uL/min • C18, C8, and C4 columns • Single wavelength UV-VIS detector • LCT • Electrospray ionization • Time-of-flight MS (TOF) • 100-6,000 m/z • Capable of accurate mass spectrometry • 5 ppm error for formula confirmation
BrukerAutoflex III • MALDI-TOF mass spectrometer • 200-150,000 m/z • Can make both positive and negative ions from same spot • Easy to interpret mass spectra for large polymers • Matrices available for wide array of analytes
Thermo MAT-95XP • Magnetic sector mass spectrometer • Accurate mass spectrometry is its main function • Electron ionization and Chemical ionization sources • Trace GC available for low MW species or mixture analysis
Accurate Mass Spectrometry • Accurate mass spectrometry can unambiguously confirm chemical composition • Mass accuracy is often reported as a relative value • ppm = parts per million, 1 ppm = 0.0001% • 5 ppm error is used by many journals as a standard to confirm a chemical formula • Instrumentation in the IU MSF routinely achieves this level of accuracy • 5 ppm at mass 300: 300 * (5/106) = ±0.0015 Da
Formula Matching Basics • Atomic weights are not integers (except 12C) • 14N = 14.0031 Da; 1H = 1.0078 Da • 16O = 15.9949 Da; 127I = 126.9045 Da • Table of isotopes link on MSF website • Difference from integer mass is called “mass defect” • Related to nuclear binding energy (E = mc2) • Sum of the mass defects depends on formula • H, N increase mass defect • Eicosane (C20H42) = 282.3286 • O, Cl, F, Na decrease it • Morphine (C17H19NO3) = 285.1365
More Formula Matching • Accurate mass measurements narrow down possible formulas for a given molecular weight • 534 entries in NIST’08 library @ mass 285 • Only 3 formulas within 5 ppm of 285.1365 • 46 compounds with formula C17H19NO3 • Mass spectrum and user info complete the picture • Isotope distributions indicate / eliminate elements • User - supplied info eliminates others (e.g. no F) • Suggested formula has to make chemical sense
Formula Matching Example Zoloft C17H18Cl2N Only 9 ways to combine up to 40 C, 50 H, 5 N, 5 O, and 2 Cl to get a mass within 20 ppm (0.0061 u) of 306.0820, only 3 have 2 Cl
Accurate MS Notes • Accurate MS is possible with the MAT-95 and LCT mass spectrometers • Bruker MALDI-TOF can do 20 ppm mass accuracy • Only MSF staff can perform accurate mass measurements • All accurate MS submissions MUST include a nominal (low res) mass spectrum to demonstrate purity PRIOR to accurate MS
Upcoming Lectures • All in C033 from 5:30-6:15 • Small molecule EI and GC-MS (10/14) • Small molecule ESI/APCI and LC-MS (10/18) • Biomolecule/polymer analysis by ESI and MALDI (10/20) • Possible special interest seminars in November • Quantitation and other advanced topics for small molecule MS • Intro to Bioinformatics • These will only occur if sufficient interest is expressed • For a more in-depth treatment of all topics covered, take C613 in the spring!