Download
1 / 18
180 likes | 358 Views
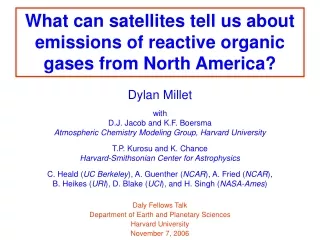
OMI HCHO measurements to test isoprene emissions and land cover. Dylan Millet, Daniel Jacob, and May Fu Harvard University Thomas Kurosu and Kelly Chance Harvard-Smithsonian Astrophysical Observatory Alex Guenther NCAR Colette Heald UC Berkeley. GEOS-Chem Meeting April 11, 2007.

E N D
OMI HCHO measurements to test isoprene emissions and land cover Dylan Millet, Daniel Jacob, and May Fu Harvard University Thomas Kurosu and Kelly Chance Harvard-Smithsonian Astrophysical Observatory Alex Guenther NCAR Colette Heald UC Berkeley GEOS-Chem Meeting April 11, 2007
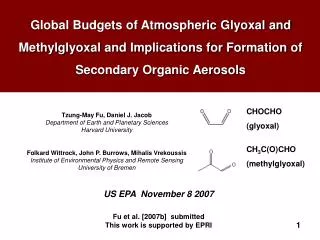
HCHO Columns Map Isoprene Emissions from Space Formaldehyde (HCHO) is a major breakdown product in the oxidation of isoprene Giving us an isoprene emission proxy that can be measured from space
Relating HCHO Columns to Isoprene Emission ΩHCHO Isoprene a-pinene detection limit propane 100 km Distance downwind VOC source HCHO vertical columns measured by OMI (Summer 2006) OH, h ki, Yi OH, h kHCHO HCHO VOCs Local ΩHCHO-Ei Relationship Palmer et al., JGR (2003,2006) Millet et al., JGR (2006)
Relating HCHO Columns to Isoprene Emission INTEX-A Measured HCHO production rate vs. column amount What drives variability in column HCHO? Isoprene dominant source when ΩHCHO is high Other VOCs give rise to a relatively stable background ΩHCHO Not to variability detectable from space Millet et al., JGR (2006). ΩHCHO variability over N. America driven by isoprene
Measuring HCHO from Space SBUV instruments in low Earth orbit GOME SCIAMACHY OMI 1995-2001 40 x 320 km footprint global coverage: 3 days 2002-present 30 x 60 kmfootprint global coverage: 6 days 2004-present 13 x 24 kmfootprint global coverage: 1 day
OMI (2006) vs. GOME (1996-2001) June-August GOME OMI OMI: better counting statistics, cloud filtering less retrieval noise 10-20% lower than GOME (accounting for interannual climate differences)
Relating HCHO Columns to Isoprene Emissions [1015 molecules cm-2] [1013 atomsC cm-2 s-1] ΩHCHO = SEisoprene+ B Uniform ΩHCHO-Eisoprene relationship Variable ΩHCHO-Eisoprene relationship OMI Isoprene Emission
Model of Emissions of Gases and Aerosols from Nature Vegetation-specific baseline emission factors Environmental drivers (T, h, LAI, leaf age, …) Guenther et al., ACP (2006) Drive MEGAN with 2 land cover databases Broadleaf trees Broadleaf trees G2006 Guenther [2006] (MODIS) CLM Community Land Model (AVHRR) MEGAN Isoprene Emissions w/ G2006 vegetation MEGAN Isoprene Emissions w/ CLM vegetation 12.2 TgC [1013 atomsC cm-2 s-1]
Spatial Patterns in Isoprene Emissions MEGAN higher than OMI over dominant emission regions Large sensitivity to surface database used MEGAN with CLM vegetation MEGAN with G2006 vegetation OMI OMI MEGAN MEGAN OMI – MEGAN Isoprene Emissions June-August, 2006 OMI – MEGAN Isoprene Emissions June-August, 2006
Bottom-Up Emissions Too High in Dominant Source Regions MEGAN emissions >70% too high over much of the Ozark Plateau, Upper South, Upper Midwest OMI – MEGAN Isoprene Emissions June-August, 2006 MEGAN w/ G2006 Land Cover Large regional emissions driven by oak tree cover, high temperatures Broadleaf tree isoprene emissions overestimated MEGAN w/ CLM Land Cover G2006 Broadleaf Trees
CLM-Driven Emissions Too Low in Deep South Bias in modeled emissions: >100% OMI – MEGAN Isoprene Emissions June-August, 2006 Underestimate of broadleaf tree or shrub coverage -or- Modeled emissions from evergreen trees or crops too low CLM Fineleaf Evergreens CLM Crops [1013 atomsC cm-2 s-1]
Constraints on Emission Factors Regress OMI isoprene emissions against G2006 PFTs Variable EFs Broadleaf tree emissions need to be uniformly decreased by 44% Constant EFs More consistent with OMI Optimum broadleaf tree EF: • 13.1 x 10¹² atomsC/cm2/s •similar to MEGAN mean • rejects MEGAN’s use of 3-4x higher EFs in certain locations Possible explanation for OMI-MEGAN discrepancy: Fast chemical loss within forest canopies? Farmer and Cohen [2007]
MEGAN isoprene emissions using 2 land cover databases Guenther [2006] (MODIS) – G2006 Community Land Model (AVHRR) - CLM PFT Coverage and Isoprene Emission Factors (EFs) Isoprene Emission G2006 CLM EF [%] [1010 atomsC/cm2/s] [1013 atomsC cm-2 s-1]
OMI Isoprene Emission vs. MEGAN-CLM OMI isoprene emission (uniform slope) OMI isoprene emission (variable slope) MEGAN w/ CLM vegetation Uniform ΩHCHO-Eisoprene relationship Variable ΩHCHO-Eisoprene relationship OMI - MEGAN OMI - MEGAN [1013 atomsC cm-2 s-1]
OMI Isoprene Emission vs. MEGAN-G2006 OMI isoprene emission (uniform slope) OMI isoprene emission (variable slope) MEGAN w/ G2006 vegetation Uniform ΩHCHO-Eisoprene relationship Variable ΩHCHO-Eisoprene relationship OMI - MEGAN OMI - MEGAN [1013 atomsC cm-2 s-1]