Download
1 / 28
280 likes | 503 Views
Vegetation Patterns of the Tallgrass Prairie: A Proposal. Daniel McGlinn. Map courtesy of PG Earls. McGlinn 2005. Outline. Introduction The Species pool hypothesis and turnover The Tallgrass Prairie Preserve Management methods and goals Species-area and species-time theory

E N D
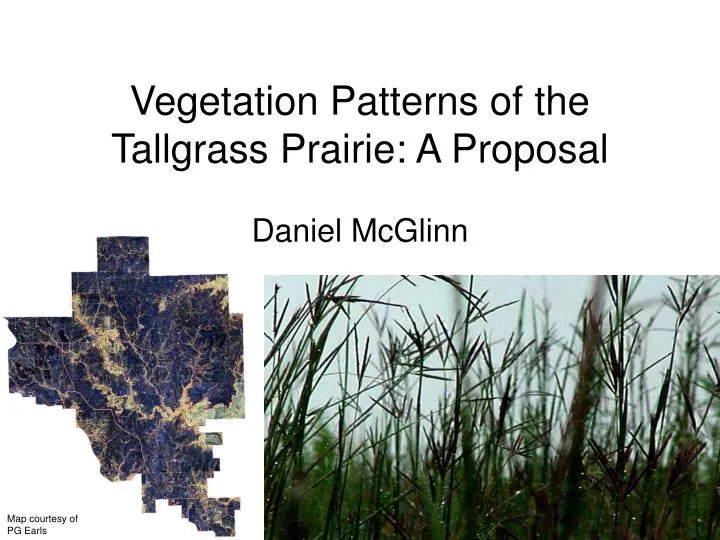
Vegetation Patterns of the Tallgrass Prairie: A Proposal Daniel McGlinn Map courtesy of PG Earls
McGlinn 2005 Outline • Introduction • The Species pool hypothesis and turnover • The Tallgrass Prairie Preserve • Management methods and goals • Species-area and species-time theory • Preliminary analyses: diversity through space and time • Future Questions
McGlinn 2005 Speciation large-scale migration small-scale migration dispersal Filtering Actual species pool Local species pool Regional species pool Species pool hypothesis Abiotic factors and Biotic interactions Redrawn from Zobel 1997
McGlinn 2005 Development of Species-pool hypothesis • Importance of regional species pool • Zobel 1997 • Evolutionary or historic soil conditions determine local species richness (SR) • Pärtel 2002 and Ewald 2003 • Exotics may provide key insight • Palmer 2003
McGlinn 2005 Field of Dreams hypothesis • Special case of Species-pool hypothesis • Palmer et al. 1997 • If you build it (disturbance regime), they will come… • Evolutionary pattern of burning and grazing • Predicts an increase in natives and a decrease in abundance and richness of exotics
McGlinn 2005 Speciation large-scale migration small-scale migration dispersal Filtering Actual species pool Local species pool Regional species pool Species pool hypothesis Abiotic factors and Biotic interactions Redrawn from Zobel 1997
McGlinn 2005 Turnover • Species level • Carousel model: van der Maarel & Sykes 1997 • Mobility indices: Palmer and Rusch 2001 • Community level • Species-area curve: Watson 1859 • Species-time curve: Preston 1960
McGlinn 2005 Community level turnover • Species-area and species-time relationships • Preston’s (1960) ergodicconjecture – Rosenzweig 1995,1998 • Tested for time-space interaction – Adler and Lauenroth (2003) • Sampling and ecological effects – White (2004)
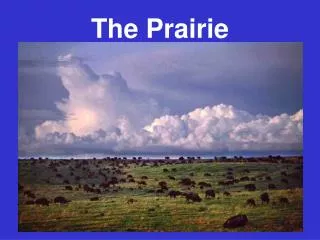
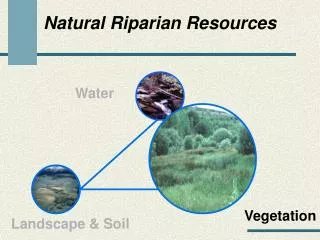
McGlinn 2005 The Tallgrass PrairiePreserve • 15,000-hectare natural area • Owned by TNC since 1989 • Bison introduced 1993 • Randomized burning regime began 1993 • Ecological goal: • To create a heterogeneous landscape that contains the full compliment of native species
McGlinn 2005 Current data • UTM grid 1997-2000 • 20 quadrats resampled 1998-2004 • Plots chosen randomly with criteria that it not have any woody cover, standing water, or >20% rock cover
McGlinn 2005 10 m Map courtesy of PG Earls
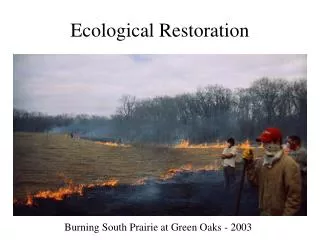
McGlinn 2005 Randomized Burning • Simulate the presettlement fire frequency and seasonality • Burn units selected randomly from areas with a minimum fuel load • Creates aspatially and temporally dynamic landscape
McGlinn 2005 Species-area and Species-time • Structure of the equation • c, z, and w values • Empirical results • linearity and nonlinearity • Mechanisms drive patterns • Statistical, ecological, evolutionary
McGlinn 2005 Structure of SAR • c and z values; • c is often only interpreted as a mere intercept • Non-linear form of SAR shows that c actually helps to determine the slope
McGlinn 2005 Structure of STR • Same as SAR • Rate of species accumulation is w
McGlinn 2005 Empirical curves from the TGPP Fig from Palmer et al. (2003) z = 0.30 Log # Species Log Area
McGlinn 2005 Empirical patterns Rosenzweig 1995
McGlinn 2005 TGPP quadrat scale Preston 1960
McGlinn 2005 Current findings • Species richness has significantly increased in the twenty 10x10 plots from 1998 to 2004 • SAR is slightly convex in log-log space • STR more linear in log-log space • The rate of species-accumulation decreases at the same rate for increasing area and increasing time
McGlinn 2005 Mean r2 = 0.9816
McGlinn 2005 Mean r2 = 0.9982
McGlinn 2005 z w log A log T Decreasing rate of species accumulation Slopes of species-area curves Slopes of species-time curves
McGlinn 2005 Remaining questions • Continue to resample plots • When does ecological change begin to take place • How does fire and grazing effect the shape of this relationship • At what scale do spatial and temporal accumulation of species seem equivalent? • Is this the same as for Konza (47 m2)? • Is the way that organisms move from one location to another analogous to their ‘movement’ through time?
McGlinn 2005 Questions
McGlinn 2005 Other explanations abound… • Exotics maintain or increase • A more heterogeneous landscape structurally provides more niches • Exotics are inherently generalists and can adapt rapidly to new environments – highly plastic phenotypes