Download
1 / 17
170 likes | 300 Views
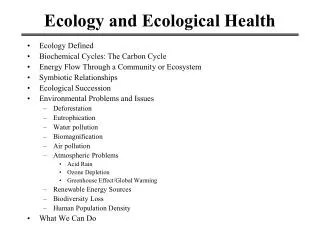
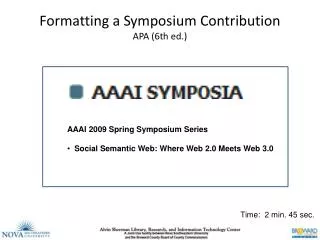
Formatting A Scorecard For Ecological Health. Josh Collins June 9, 2008.

E N D
Formatting A ScorecardFor Ecological Health Josh Collins June 9, 2008 Our main charge should be to identify indicators of progress toward CCMP goals and objectives, and to organize the indicators into a score card, and produce a score as best we can. Its essential to use our collective experience to build on what has already been done. A secondary charge is to try to fit the scores to the WAF. This focus enables us to do some useful things, such as identify barren goals (they have no indicators) or orphan indicators (they have no goals), while establishing how to report CCMP progress.
Formatting A ScorecardFor Ecological Health • The ideal format should: • visually convey the method and results of scaling and combining indicators in a transparent way (although separate explanations of the indicators might be required) • Be intuitive and quantitative • Be scale-independent • Be flexible to support adaptive management and to revise indicators based on new science and changing goals.
Biotic HGM Landscape Chem/Phys Disturbance Eco Process WAF Indicator Categories CCMP Program Areas WAF identifies attributes of watershed health (i.e., categories of indicators) but doesn’t define health or state how to measure it. Likewise, the CCMP identifies broad categories of concern and associated goals and objectives but does not define success or how to measure progress. The CCMP and WAF were developed independently and do not fit each other, although the CCMP Program Areas might be forced into the WAF categories Aquatic Resources Wildlife Wetlands Management Water Use Pollution Prevention and Reduction Dredging and Waterways Modification Land Use and Watershed Management Public Involvement and Education Research and Monitoring
CCMP Framework . Caution: unless the WAF adopts standard indicators for its health attributes, watersheds cannot be compared to each other or over time – the attributes are just a first step toward standardization We have a chance to go farther with the CCMP. Its goals are specific enough to serve as criteria to sort existing data and indicators, and thus assess progress (where data are available) or identify where either data or goals are needed. We might propose how existing indicators might be standardized for tracking progress in the future.
Biotic HGM Landscape Chem/Phys Disturbance Eco Process 1 2 Zero Sediment Impairment All Sampled Reaches Stable WAF Indicator Categories Imagine two CCMP Goals, “Zero Sediment Impairment” and “All Sampled Stream Reaches are Stable,” that fit into the WAF Category called “Hydro-geomorphology” (any number of Goals could “fit” into any WAF Category).
Biotic HGM Landscape Chem/Phys Disturbance Eco Process 100 1 2 75 50 25 0 HGM BMP Effectiveness 1/% if Aggrading Reaches 1/% if Degrading Reaches % Sediment TMDL achieved WAF Indicator Categories Imagine that there are two indicators of progress for each of the two CCMP Goals (there can be any number of indicators for any Goal). The indicators can be scaled from 0 (no progress) to 100 (goal achieved) Percent Progress Toward Goal
Biotic HGM Landscape Chem/Phys Disturbance Eco Process 100 1 2 75 50 25 0 WAF Indicator Categories Percent Progress Toward Goal The height of the bar for any indicator is one measure of progress toward the associated CCMP Goal % Sediment TMDL achieved
Biotic HGM Landscape Chem/Phys Disturbance Eco Process 100 1 2 75 50 25 0 WAF Indicator Categories The total area of all the indicator bars for a given CCMP Goal is equal to the total progress toward that Goal. It can be reported as a percentage of the total area from 0 to 100 for all indicators for that Goal. Percent Progress Toward Goal HGM BMP Effectiveness % Sediment TMDL achieved
Biotic HGM Landscape Chem/Phys Disturbance Eco Process 100 1 2 75 50 25 0 HGM BMP Effectiveness 1/% if Aggrading Reaches 1/% if Degrading Reaches % Sediment TMDL achieved WAF Indicator Categories The total area of all indicator bars for a given WAF Category is equal to the total progress within that Category. It can be reported as a percentage of the total area from 0 to 100 for all indicators for that Category. Percent Progress Toward Goal
Biotic HGM Landscape Chem/Phys Disturbance Eco Process 100 1 2 75 50 25 0 WAF Indicator Categories Any indicator can be weighted by increasing the width of its bar. This will proportionally weight the associated CCMP Goal by increasing the width of its bar. Percent Progress Toward Goal HGM BMP Effectiveness 1/% if Aggrading Reaches 1/% if Degrading Reaches % Sediment TMDL achieved
Biotic HGM Landscape Chem/Phys Disturbance Eco Process 100 75 50 25 0 WAF Indicator Categories 1 2 Any CCMP Goal can be independently weighted by increasing the width of its bar, while maintaining equal widths of the associated indicator bars. Percent Progress Toward Goal HGM BMP Effectiveness 1/% if Aggrading Reaches 1/% if Degrading Reaches % Sediment TMDL achieved
100 75 50 25 0 WAF Indicator Categories Eco Process Biotic Chem/Phys HGM Landscape Disturbance Percent Progress Toward Goal Status of progress can be quantified and graphically displayed for any combination of indicators and Goals.
WAF Indicator Categories Eco Process Biotic Chem/Phys HGM Landscape Disturbance 100 75 50 25 0 Percent Progress Toward Goal Status of progress can be quantified and graphically displayed for all indicators of all CCMP Goals for all WAF Categories
Biotic HGM Landscape Chem/Phys Disturbance Eco Process 100 75 50 25 0 WAF Indicator Categories Some indicators will have sampling variability that can be used to report a range of likely progress rather than a simple numerical value. Percent Progress Toward Goal HGM BMP Effectiveness 1/% if Aggrading Reaches 1/% if Degrading Reaches % Sediment TMDL achieved
Biotic HGM Landscape Chem/Phys Disturbance Eco Process 100 75 50 25 0 WAF Indicator Categories In some cases, the Goal will be an average condition for which there will be sampling variability. Percent Progress Toward Goal HGM BMP Effectiveness 1/% if Aggrading Reaches 1/% if Degrading Reaches % Sediment TMDL achieved
Biotic Landscape Chem/Phys Disturbance Eco Process 100 75 50 25 0 WAF Indicator Categories Can the sample variability of the Goal be pooled with the variability of the associated indicators to estimate the overall range in progress for the Goal? . Percent Progress Toward Goal HGM BMP Effectiveness 1/% if Aggrading Reaches 1/% if Degrading Reaches % Sediment TMDL achieved
100 75 50 Overall ConditionRelative to Goals 25 0 Time Change in any combination of indicators or goals, including overall rate of progress for all indicators, can be plotted over time