Download
1 / 59
590 likes | 745 Views
A kind reminder on distractions such as phone use, noise (see syllabus). Please allow fellow students to focus. E.G. please always turn off your cell phone or put it on vibrate mode for class. GIS for environmental management Dr. William James Smith, Jr.

E N D
A kind reminder on distractions such as phone use, noise (see syllabus). Please allow fellow students to focus. E.G. please always turn off your cell phone or put it on vibrate mode for class GIS for environmental management Dr. William James Smith, Jr. Assistant Professor of Environmental Studies, UNLV Adjunct Assistant Professor in Geography, The University of Iowa
GRADUATE STUDENTS MUST PUT THEIR FINISHED PRODUCTS FOR LABS 7, 8, 9 ON THEIR OWN WEB SITE – OPTIONAL FOR UNDERGRADS. YOU NEED YOUR BOOKS NEXT WEEK! UPDATE ON SOFTWARE ISSUES I am able to setup the first opening hour for Spring 2006.Every Friday from 1:30pm to 5pm. State of your labs and exercises and databank http://www.geog.ubc.ca/courses/klink/gis.notes/ncgia/u27.html#SEC27.6.1
Cartographic roots and map projections Using Arcview software
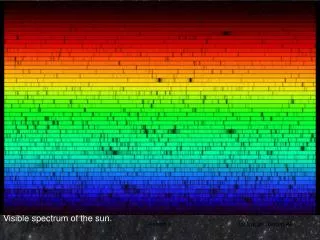
Cartography The science that deals with the construction, use, and principles behind maps and map use. Old fashioned cartographers worked strictly on paper… but they are not the oldest -- ancient Greek Ptolemy (father of latitude and longitude and map projections).
Ch 2 clarke How could we map these stats (provide x, y, z coords?)
Map scale and projections The shape of the earth But paper is! Nevertheless, earth is a oblate ellipsoid or spheroid (not a sphere since it is a little wide around the equator than tall from pole to pole.
Remote sensing and improving global position technology has improved ellipsoid estimation, allowing better measurement of the elevation of every point on earth, including sea level! This is called the datum. Newer datums have been calculated using the center of the earth as the reference point (instead of a point on the ground).
In mapping the US we will often use the datum introduced in 1983 called the North American Datum (NAD 83) -- there is still some error. This is part of the geodetic reference system (GRS80) used internationally. The U.S. military adopted much of this work but refined the values to create the world geodetic system (WGS84). This matters to you because when you use or compare maps you need to know the datum and ellipsoid reference information, as at large scales (more detailed) there can be significant differences, especially in elevation. You also need to know this when using a GPS receiver due to differences in coordinates.
But what if I need extra accuracy?! The science of geodesy, which measures the earth’s size, shape, and gravitational fields exactly has resulted in mapping out of local variations from the ellipsoid and calls the surface it produces a geoid. Truth is cartographers often use the sphere as the reference base. For finer detail (large scale) maps and maps that are very much smaller (e.g. around 1:100,000) this can produce big differences.
What is map scale? EVERY map has scale -- be it paper or digital, and every map you use will represent a REDUCED representation of the world… or of what use would it be (1:1)?! Representative fraction is the term used for defining the amount of scaling. This is the ratio of distances on the map to the distances on the ground.
A model train is usually about 1:40 scale, meaning every distance on the model is one-fortieth of its size on the real train.
But the world is so big we have to get some small values for the representative fractions!
According to various measurements the distance around the “average world” is 40,078,346.23 meters (24,903.22miles). Representative fraction map distance(m)distance in feet (approx) 1:400,000,000 .10002 .328 (3.9 inches) (earth mapped onto a gumball) 1:40,000,000 1.00023.28 (earth mapped onto a basketball) 1:24,0001,666.99 5,469 (1.036 miles) * A 1:1,000 map with lots of detail would mean the equator on the map would be twice the length of Manhattan Island. http://convert.french-property.co.uk/ The original definition of a meter was one ten-millionth of the distance from the equator to the north pole measured along a meridian passing through Paris. No wonder metric is easier to make computations with!
* A 1:1,000 map with lots of detail would mean the equator on the map would be twice the length of Manhattan Island. http://convert.french-property.co.uk/ The original definition of a meter was one ten-millionth of the distance from the equator to the north pole measured along a meridian passing through Paris. No wonder metric is easier to make computations with!
Most national GIS mapping for the U.S. is between 1:1,000,000 and 1:24,000. Understanding the right scale for the level of detail needed is vital. GIS allows one to zoom in and zoom out, but you still must make good choices in map making, and if the details come from data you pulled from a map at, say, 1:100,000 scale, then zooming in on the same data might make them look bigger, but there is not the data of a 1:10,000 map! Demo on NV Quad
But, even with the right scale, we still have to fit a ellipsoid to a flat screen or piece of paper! The part of cartography that deals with this is called map projections. You can’t memorize every potential map projection and where it is appropriate for in the world, but we can define general groups and explore examples together.
Distance between Lines If you divide the circumference of the earth (approximately 25,000 miles) by 360 degrees, the distance on the earth's surface for each one degree of latitude or longitude is just over 69 miles, or 111 km. Minutes and Seconds For precision purposes, degrees of longitude and latitude have been divided into minutes (') and seconds ("). There are 60 minutes in each degree. Each minute is divided into 60 seconds. Seconds can be further divided into tenths, hundredths, or even thousandths.
You are here - http://www.geocode.com/modules.php?name=TestDrive_Eagle
Map projections are attempts to portray the surface of the earth or a portion of the earth on a flat surface. Some distortions of conformality, distance, direction, scale, and area always result from this process. shape Some projections minimize distortions in some of these properties at the expense of maximizing errors in others. Some projection are attempts to only moderately distort all of these properties.
* Conformality - When the scale of a map at any point on the map is the same in any direction, the projection is conformal. Meridians (lines of longitude) and parallels (lines of latitude) intersect at right angles. Shape is preserved locally on conformal maps. * Distance - A map is equidistant when it portrays distances from the center of the projection to any other place on the map. * Scale - Scale is the relationship between a distance portrayed on a map and the same distance on the Earth.
* Area - When a map portrays areas over the entire map so that all mapped areas have the same proportional relationship to the areas on the Earth that they represent, the map is an equal-area map. shape
Different map projections result in different spatial relationships between regions.
Four major classes of map projections: 1. Cylindrical projections result from projecting a spherical surface onto a cylinder. 2. Conic projections result from projecting a spherical surface onto a cone. 3. Azimuthal projections result from projecting a spherical surface onto a plane.
4. Miscellaneous projections include unprojected ones such as rectangular latitude and longitude grids and other examples of that do not fall into the cylindrical, conic, or azimuthal categories. The line(s) on the map where the cut falls on the projection act like a globe, that is, that is an area with no distortion -- the nearer the line the less problems. If the line coincides with a parallel of latitude then it is a standard parallel. PP 42-44 Clarke At http://www.colorado.edu/geography/gcraft/notes/mapproj/mapproj_f.html Review from “Map projections fall into four general classes.”
Map projection options continued http://www.lib.utexas.edu/maps/cartographic_reference.html http://www.swopnet.com/waypoints/
Bottom line -Larger area mapped = more important the errors due to proj are. -The proj should fit the application (e.g. calculating areas vs dist.) *Many GIS can convert geographic coordinates to several map projections (you will do this next), some can go backwards from from map coordinates in a projection to lat/long. -Do not unintentionally mix. E.G. in the U.S., until recently most 1:24,000 topographic map series of the USGS used a polyconic projection, the Clarke 1866 ellipsoid, and NAD27 datum but now, you see a continued shift to NAD83 datum and ellipsoid named GRS80. This has “moved” features by as much as 300 meters on the ground or 12.5 milimeters (.49 inch) on 1:24,000 maps.
Datum and coordinate systems overviews http://www.colorado.edu/geography/gcraft/notes/datum/datum.html STOP HERE
http://ccs.unlv.edu/scr/support/labs/questions.aspI have copied the section of creating web site.How to create a website using your SCR Computer Labs account?You can host web pages over the World Wide Web using your Home Directory. Log into your SCR Computer Labs account. Browse to the Home Directory or H:\ drive. Create a folder titled: public_html. Place all images and .htm/.html files inside the public_html folder. Make sure to name the first page or homepage index.htm. The URL for your website will be http://complabs.nevada.edu/~username. Substitute username for your SCR Computer Lab account username (what you use to login). Demo philippinefamily and GIS Café email me for it Arcview list Truly,Pak-Kwan (John) NgComputer Facilities SupervisorStudent Computing ResourcesUniversity of Nevada, Las VegasEmail: Pak-Kwan.Ng@unlv.eduOffice phone:(702)895-5370
NAME, ISBN, PURCHASED FROM TEST ALL COMPUTERS New data on computers
Normal progression to these topics v. cliff notes puzzle version Samples of MP from book
Why study these issues? Maps sharing the same coordinate systems, datum and projected the same can align with each other. Vs digitizing off varying data
Geodetic datums define earth’s size and shape, and thus, how best to apply coordinate systems that will fit that surface (resulting in maps). E.G. the right datum makes it possible to figure the elevation at a point. If the earth was a perfect sphere, knowing the center would do what for distance? Knowing the shape and size also allows us to fit map projections better. Hundreds of different datums have been used to frame position descriptions since the first estimates of the earth's size made by Aristotle.
Remember, mapping the US we will often use the datum introduced in 1983 called the North American Datum (NAD 83) (300ft) The U.S. military adopted much of this work but refined the values to create the world geodetic system (WGS84). Coordinate system Map projection North American datum 83 associated with this earth shape
Absolute location is in reference to an origin or “zero point” (e.g. the equator and prime meridian for lat/long). To convert maps into numbers, standard ways to encode locations as numbers are key -- these are coordinate systems. (you can’t just say relative location, like, not far from the post office,)!
Placing the frame on the clay, so the picture/map can be hung. Computers and plotters can understand distance from a zero point in a x,y format (easting going east-west, northing north-south) -- this is called a coordinate pair, put into standard coord systems. P 47 Clarke fig. 2.11 and 2.12 Demo align vs non. Where is the origin or zero pt?
Four major systems 1. Geographic coordinates 2. Universal transverse Mercator (UTM) favored for many efforts 3. Military grid system (alt. Form of UTM) adopted by some countries and used for world mapping. 4. State plane (basis of most surveying in the U.S.)
Geographic coordinates Storage of locations as numbers using lat/long aka geographic cords. This system was standardized in 1884. Greenwich Observatory
Demo Mt. Charleston gas stations open or closed - add graphic over projected data - add lat/long - change theme name - display by id and value 1 vs. 0 Demo world label lat/long overlay and countries unproj graphic to shp add xy = same
In a GIS lat and long are nearly always geocoded, or captured from the map into the computer in 1 of 2 ways. 1. Degrees, minutes, and seconds (DMS) 2. Decimal degrees (DD)
Latitude goes from 90 degrees south (-90) to 90 degrees north (+90) Long is the same except range is -/+180 degrees. 1 of 2 formats 1. DMS as a +/- DD.MMSS.XX here DD are degrees, MM are minutes and SS.XX are decimal seconds. Or,
DD DD.XXXX aka decimal degrees (like time 60 min has 60 secs) At the equator 40,000km per 360 degrees = 111.11km, so .001 degree = 111 meters resolution (accuracy relative to perfect coastline of Africa in fig. 2.12 in Clarke).
The major advantage to “unprojected” geographic coordinates is that if many maps are captured the data can be transformed in a projection “on the fly” so they overlay in whatever projection you choose. If maps already projected are changed to GC then they could overlay. Unprojected maps include those that are formed by considering longitude and latitude as a simple rectangular coordinate system. Scale, distance, area, and shape are all distorted with the distortion increasing toward poles.
Universal Transverse Mercator Coordinate System (UTM) -- included on USGS topo maps since the late 1950s. 60 pole to pole zones, each 6 degrees of long wide, within each zone we draw a transverse mercator projection centered on the middle of the zone oriented N-S to form a central meridian (the equator meets it at right angles, with a secant along 2 lines parallel to the central meridian. http://www.colorado.edu/geography/gcraft/notes/coordsys/gif/utm14det.gif In 1772 Lambert modified the Mercator projection into transverse form to make the “equator” run north-south to form narrow strips to mitigate distortion. That form was used to map Mars too.