Download
1 / 21
210 likes | 336 Views
The Sun. Sol. Solar Data. Mass (kg) 1.989x10 30 Mass (Earth = 1) 332,830 Equatorial radius (km) 695,000 Equatorial radius (Earth = 1) 108.97 Mean density (gm/cm 3 ) 1.410 Surface gravity (m/s 2 ) 273 Rotational period (days) 25-36 Escape velocity (km/sec) 618.02

E N D
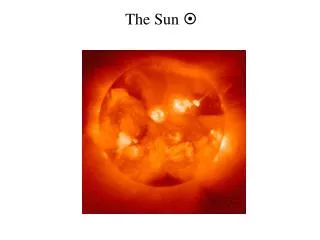
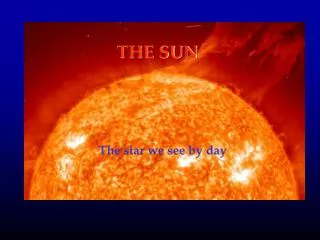
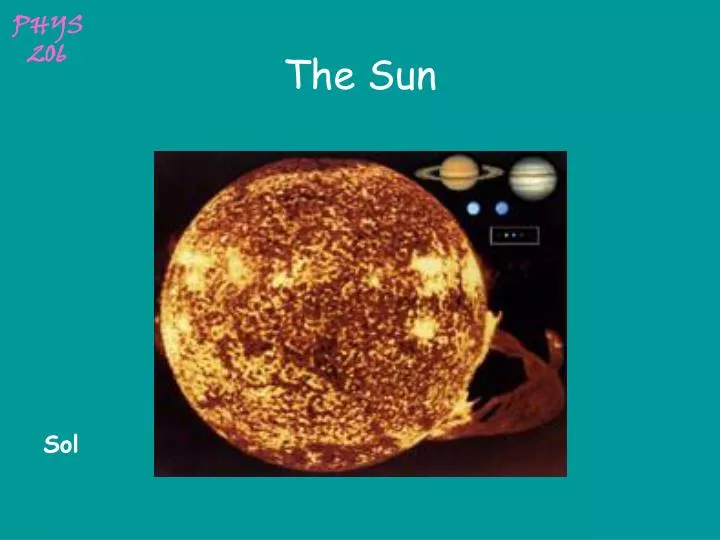
The Sun Sol
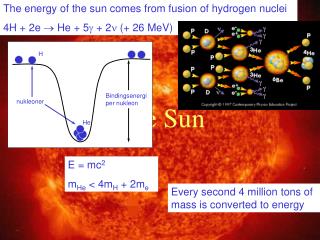
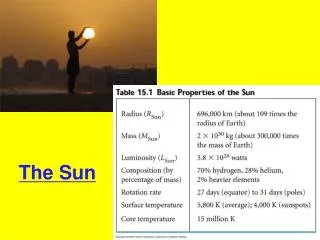
Solar Data Mass (kg) 1.989x1030 Mass (Earth = 1) 332,830 Equatorial radius (km) 695,000 Equatorial radius (Earth = 1) 108.97 Mean density (gm/cm3) 1.410 Surface gravity (m/s2) 273 Rotational period (days) 25-36 Escape velocity (km/sec) 618.02 Luminosity (ergs/sec) 3.827x1033 Apparent Visual Magnitude -26.8 Absolute Visual Magnitude +4.8 Spectral Class G2 V Mean surface temperature 5,800°C Age (billion years) 4.5 Principal chemistry (by mass) Hydrogen 73.4% Helium 25.0% Oxygen 0.8% Carbon 0.3% Iron 0.2% Nitrogen 0.1% Silicon 0.07% Neon 0.05% Magnesium 0.06% Sulfur 0.04% All others 0.2%
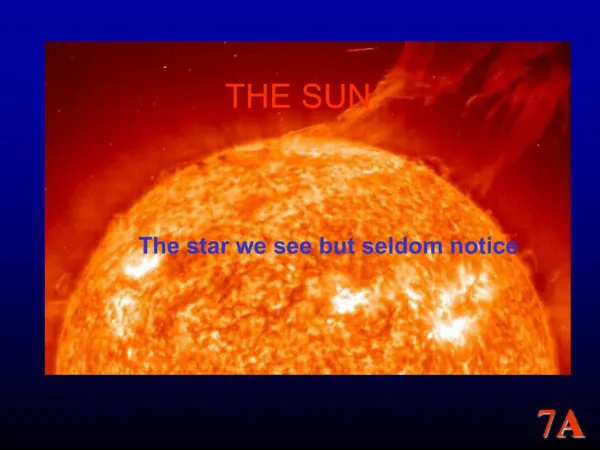
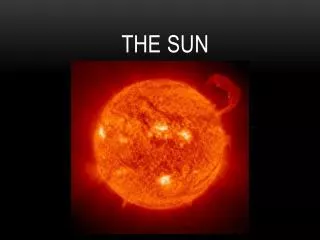
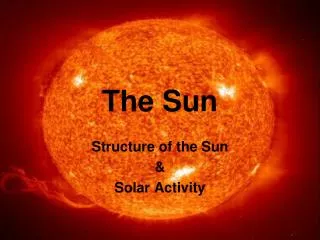
Sun’s Surface Three major parts: Photosphere, Chromosphere and Corona • Photosphere: • What we observe when we look at the Sun. 96 % of the light we are receiving from the Sun comes from the top 400 kms of the Sun. • We can learn the temperature, pressure and density from the spectrum. • T is about 5000 K. • Pressure is about 1/100 of sea level. • Density is about 1/10000 of sea level.
Chromosphere First discovered during Solar Eclipses. Thin colorful layer, hence the name chromo (color) sphere. Today -> we use a device called Coronagraph The light comes from H- ions and Helium. Thickness of the chromosphere is 2,000-3,000 kms.
Spicules in the Atmosphere The temperature in the atmosphere increases with distance (not what you would expect) At the top of the chromosphere the temperature is about 10,000 K. In the region between the corona and the chromosphere the temp goes from 10,000 K to 1,000,000 K within a few kms -> transition region. The transition region is found at different heights above the chromosphere. The existence of jet-like spikes called the spicules might explain this phenomenon.
Corona Corona is what the scientists are after during a Solar Eclipse. Question: Why are they so interested in the corona? Answer: Because the temperature is over one million degrees in the corona.
Corona Properties The temperature of the corona is more than 1,000,000 K. The corona extends for millions of kms. (reaches beyond the Earth) Gives out only half as much light as a full moon. Very low density (1/10,000,000,000 of sea level) But because of the high T, the corona is an X-ray source. Dark regions in the X-ray, Coronal Holes -> no trapping of corona by magnetic field.
Temperatures in the Solar Atmosphere • 5,000 K at the photosphere • Rises to 100,000 K in the chromosphere • In the transition region within few kms the temperature increases to 1,000,000 K • Density of the atoms is very low in the corona -> heat is not “dangerous”, cannot even heat up a cup of coffee. • Temperature gradually drops down when we move away from the Sun.
Solar Wind When you look at the sun using visible light, the corona looks quite uniform. However, if we use X-rays (corona is a source of X-rays), we see that there are patches in the corona -> coronal holes. Coronal holes are cool and quiet, and they are usually located at the poles. Magnetic fields leave the Sun, and then they usually loop back to the Sun trapping the hot gases in these loops -> hot gases radiate light. But if the magnetic field does not loop back (like around the poles), then the hot gases can stream out from the Sun -> Solar Wind. Solar wind is made up of electrons and protons, and has a speed of 400 km/s when it reaches the Earth. The solar wind has two major consequences for us:
Aurorae Solar wind causes beautiful displays of aurorae, solar particles caught by Earth’s magnetic field. Strong solar winds can also kill satellites, but this is very rare.
The Active Sun The Sun sustains the life on Earth. Life is very fragile and it takes a long time to develop. Sun has been quite stable for a long time. But stable does not mean quiet. • Granulation • Sunspots • Plages • Prominences • Solar flares
Granulation Honeycomb pattern on the Solar surface. Caused by the convection of gas. Brighter parts: Hot gas raising from inside, darker parts cooler gas falling back. Darker regions are 50-100K colder than the intergranular regions. 700km-1000kms in diameter. Not just around the sunspots.
Sunspots Sunspots are cooler regions on the surface of the Sun. About 1500K colder (still 4500K). Diameter is a few 10,000kms. Appear in groups. Even observed by Galileo. Persist for periods ranging from hours to months. Central dark region is called umbra, lighter surrounding region penumbra (just like the Solar Eclipse). Sunspots are associated with strong magnetic fields: In a pair of sunspots, one spot will have N and the other S polarity.
Solar Rotation Sun rotates around itself. The rotation is in the same sense of the motion of the planets around the Sun. Sun is not a solid body, different parts rotate differently. We use the sunspots to calculate the speed of rotation. Period at the equator is 25 days, near the poles 36 days.
Magnetic Field Sun has a very strong magnetic field – 1000 times as strong as Earth’s. Just like the Earth, the Sun also changes magnetic polarity. The period is much shorter, only 11 years. We learn this from the sunspots. For 11 years, the leading sunspots will have the same polarity (N), and then, for the next 11 years they will have the opposite polarity (S). So, actually the period is 22 years… Magnetic fields disrupt the normal processes on the surface of the Sun. Granulation is a normal process, strong magnetic fields hinder bubbling of the hot gas -> if you have strong magnetic fields you will have cooler temperatures -> Sunspots and more...
Plages Plages are cloud-like features above the photosphere. Can only be imaged using hydrogen or calcium light. Regions surrounding the sunspots. The density is higher. Hydrogen and calcium are more excited than their surroundings.
Prominences Bright clouds of gas following the magnetic field lines. Can last for many hours, even days. Eruptive prominences are shot up at 700km/s. Origin is unknown. Cool and dense regions in the corona. Related to the sunspots and plages, probably caused by strong magnetic fields.
Solar Flares Solar flares are flares, with temperature around 10,000,000 K. Lasts for a few minutes, and visible light of the Sun does not change much, however the heated gases emit X-rays and ultraviolet. Cause is not well understood. Related to the magnetic fields. Evidence suggests that flares occur when magnetic fields of opposite polarity come together and annihilate each other. During the flares’ violent explosion gases can be thrown into space.
Coronal Mass Ejections During solar flares coronal material can be ejected at high speeds. Mild ones cause beautiful aurorae. Material with electric charge can affect the ability of the atmosphere to reflect the radio waves and can disrupt the radio communications. In worse situations (happened once) solar flares can cause components in long power lines burn. During this flare some satellites were also dragged to lower orbits.
Variable Sun Meander Minimum – between 1645-1715. Little Meander Minimum early 19th century. Lower temperatures during the times of lower solar activity. But overall, the output of the Sun changes by less than 0.1% over the years.