Download
1 / 24
250 likes | 604 Views
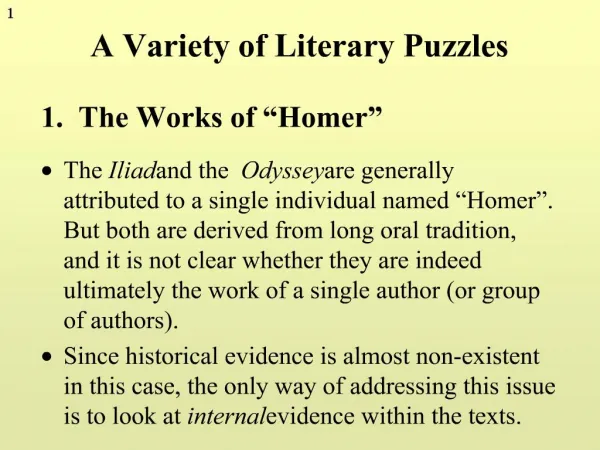
A Variety of Literary Puzzles. The Iliad and the Odyssey are generally attributed to a single individual named “Homer”. But both are derived from long oral tradition, and it is not clear whether they are indeed ultimately the work of a single author (or group of authors).

E N D
A Variety of Literary Puzzles • The Iliad and the Odyssey are generally attributed to a single individual named “Homer”. But both are derived from long oral tradition, and it is not clear whether they are indeed ultimately the work of a single author (or group of authors). • Since historical evidence is almost non-existent in this case, the only way of addressing this issue is to look at internal evidence within the texts. 1. The Works of “Homer”
2. The Letters of Saint Paul • The New Testament contains a large number of letters traditionally attributed to Saint Paul, but it is not clear whether he indeed wrote them all. In particular the letter to the Hebrews has for a long time been viewed suspiciously on theological grounds, but these are hard to make precise. • It is interesting to ask whether such theological speculations can be backed up with hard statistical data derived from textual analysis (e.g. does Hebrews have similar word frequencies and sentence lengths to Paul’s known letters?).
3. The Dialogues of Plato • Plato developed his philosophy in the form of dialogues, putting his own doctrines into the mouth of Socrates his teacher. Little of Socrates’ own work has survived, and there is clear evidence of development in the philosophy of Plato’s dialogues in various respects, but in which directions did the development take place? Knowing the order of his dialogues could be crucial for the understanding of his ideas. • Stylometric methods have been used to try to place the dialogues in the correct order.
4. The Ethics of Aristotle • There are two famous works of Ethics by Aristotle, both transcribed from lecture notes by others. These are the Eudemian Ethics and the Nicomachean Ethics. • However books 5-7 of the Nicomachean Ethics are identical to books 4-6 of the Eudemian Ethics, raising the question of which of the two sources these books originally came from. • This issue is of philosophical as well as literary interest, and has been settled using stylometric research by philosopher Anthony Kenny.
5. The Plays of Shakespeare • Notoriously Shakespeare’s plays have been attributed to a variety of authors: e.g. Bacon, Marlowe and various noblemen. • There are also a number of plays (for example Edward III and The Two Noble Kinsmen) supposed by some to have been written either by Shakespeare alone or co-authored by him. • Stylometry has the potential to bring objective analysis to bear on such (heated!) controversies, and was first attempted by Mendelhall in 1901 (without the benefit of computers, of course!).
6. The Federalist Papers • The Federalist Papers are a series of articles published in 1787-88 with the aim of promoting the ratification of the new constitution. They were written by three authors, Jay, Hamilton and Madison, under the pseudonym “Publius”. • Some of the papers are of known (and in some cases joint) authorship but others are disputed. Stylometric methods were famously brought to bear by Mosteller and Wallace in the early 1960s to attempt to answer this question. It is now considered as settled.
The Signature Stylometric Program • The Signature computer program provides a number of tools for “literary detection”. It can be downloaded from www.etext.leeds.ac.uk/signature/ together with various resource files (e.g. Federalist Papers, various novels, Shakespearean texts). • Unpack all these into a suitable base directory (e.g. C:\Signature), run signature.exe, and use “Load...” from the File menu to select your texts. • When loading texts, note that you can select many at once, by “control-clicking”, i.e. holding down the “Ctrl” key while you select the texts you want.
Frequency Tests within Signature • Having loaded your texts, highlight them within the file list box in the usual way (again control-clicking if necessary to select several) – as you do this, an appropriate graph and table will display automatically on the right-hand side of the screen. • Five different graphs (and tables) can be chosen using the “tabs” at the bottom of the screen: these display the frequency of word length, sentence length, paragraph length, letters, and punctuation. • Analysis of specific word frequencies is more advanced, and will be dealt with later.
Comparing Texts by Eye • The graphs produced by the frequency tests can give a good visual impression of the similarities and differences between texts. • This is usually much more striking if you select “Display percentages” rather than absolute frequencies (using the radio buttons at the top), as then the relative frequencies within the various texts appear on a matching scale. • Graphs can be displayed “flat” or “deep” using the “2D” or “3D” buttons. “Options” gives access to many other display possibilities.
Adding Rigour (1) - large data • Simply comparing one text with another will not necessarily give a reliable indication of common (or different) authorship – any single text, especially a short one, could be idiosyncratic for many different reasons. • Tests are far more reliable if they are carried out on large bodies of data, so if you want to check, say, a play for possible authorship by Shakespeare, it is far better to test it against ALL the relevant Shakespearean corpus (e.g. all the known tragedies, or comedies, or even all his plays) rather than just one other play.
Combining Texts • To treat several texts as a single “corpus”, select them with the mouse and click on the “Combine Files into Corpus” button under the file list box. • You’ll be invited to give a name to the corpus – take this opportunity to give a meaningful name (e.g. “Austen”, “Shakespeare tragedies”) as this will appear in your graphs and tables. (To change a corpus name or a file’s “alias”, double-click on it.) • All “corpora” will appear in the lower box. These can be graphed exactly as though they were single files (so you can combine files and corpora within a graph; to deselect all, right-click the relevant box).
Adding Rigour (2) - Statistics • You can add more rigour to your stylometric tests by replacing mere comparison of graphs by eye (which can be extremely misleading) with objective statistical measurement. • For this purpose the Signature system provides an option under the Statistics menu that performs a “Chi-Square” comparison test. It is not necessary to understand the details of how this test works (the calculations can just be left to the computer), but you do need to be able to interpret the results that it yields.
Principles of Statistical Testing • Most statistical testing works on the principle of calculating some “measure” (in this case, a measure of how far two texts differ in some respect) which is known to follow some standard “distribution” (in this case, the so-called “Chi-Square” distribution). • The form of the distribution can be looked up in statistical tables (or stored in a computer program), and then compared against the calculated measure. • The result of the test is a “p-value”, which gives the probability that mere random variation between two samples would give rise to a difference measure of at least the calculated magnitude.
Suppose we generate word length frequency data on two texts S and R, R being a large “reference” text (e.g. all the known works of some author) and S a “sample” text (e.g. a work of unknown authorship). • Then applying the Chi-Square test to these data can be equivalent to asking: • “Suppose text R gives a reliable guide to the word length frequencies used by an author (so if R contains a 20% proportion of 3-letter words, this reflects a general tendency of that author to use 3-letter words on average one word in five). Then what is the probability that such an author, writing a text of the same length as S, would purely by chance produce a text with a word length frequency (WLF) ‘spectrum’ which differs from that of R by as much as the actual WLF ‘spectrum’ of S differs?”
The Meaning of the Chi-Square Value • The “Chi-Square” value is calculated as a number, and the larger the number, the less likely it is that a text like the sample (in the measured respect, e.g. word length frequencies) could have arisen by chance from an author having the overall characteristics manifested in the reference text. • This number is usually compared against a standard value (e.g. the “5%” value or the “1%” value), to indicate whether it counts as “significant” to the corresponding degree (typically in scientific research, only a result which is at least “significant at the 5% level” is taken to be worthy of note).
If, for example, the test yields a Chi-Square value which is between the “5%” and the “1%” values, then Signature will display a message saying that the difference between the sample and reference texts is “significant at the 5% level” (i.e. sufficiently great that you’d only expect such large differences to arise by chance on average at most 1 time in 20). • Signature will also display the actual Chi-Square value given by the test, and also the two standard values between which it lies (in the case above, the “5%” and the “1%” values). This enables you to see roughly how close the actual value came to these limits (e.g. you might be able to see that it very nearly achieved significance at the 1% level).
“Statistical” and Genuine Significance • Texts vary more systematically than do the repeatable scientific phenomena for which statistical tests are most typically used. Even a “difference at the 1% level” might not be genuinely significant in context – it might be that almost any pairs of texts you took, even by the same author, would differ just as much! • So when assessing the real significance of Signature’s statistical results, it’s important to make appropriate comparisons of the Chi-Square results you get. • For this purpose, there’s an option under the File menu to divide single texts into halves, so you can see what results you get from testing one half against the other.
What Statistical Tests Do Not Prove! • Many people who use statistical tests fall victim to a natural misinterpretation of their results. • The p-value does NOT give the probability that the “sample” (in our case, the sample text) actually “came from the same population as” (in our case, had the same author as) the “reference” (the reference text). • Rather, it gives the probability that a difference of at least the magnitude measured between the “sample” and the “reference” would arise by chance if a sample of similar size were to be taken at random from the reference “population”. • THESE TWO ARE QUITE DIFFERENT!
How to Use the Chi-Square Result • To assess the actual probability that “the sample came from the same population as the reference” requires all sorts of background information – it might, for example, be known that the two works had the same (or different) author, or that one author’s style is notoriously inconsistent, or that two authors’ styles are remarkably similar. Any other relevant information bearing on the case (e.g. from conventional historical and literary studies) would also need to be taken into account in any assessment of the actual probability. • Use the Chi-Square test, therefore, to confirm the objective significance of apparent differences, rather than as a definitive assessment of probability.
Degrees of Freedom • The Chi-Square test can operate on any chosen range of data, and its results can depend very largely on what range is chosen. In a word length frequency test, for example, you could apply the test to words of ALL lengths, or just to the length range, say, 2 to 8. • The larger the range of data included, the larger the “degrees of freedom” (i.e. the scope for mere random variation to give rise to a large Chi-Square value). Hence it can be more difficult for the test to give a genuinely significant result. • It’s best to restrict the test to the visually “crucial” and “reliable” data range – where there’s plenty of data – and to exclude the long thin “tail” of the graphs where proportionately large random variation is to be expected.
Reference and Sample Texts • We have so far taken the “reference” and “sample” texts to be quite distinct, but if both are quite short, it can be best to include the “sample” text within the “reference” (there is a checkbox in Signature to do this automatically; this is ticked by default, but will be greyed out if the texts involve overlapping corpora). Applying the test is then like asking: • “Suppose we have an author whose style is typified by the combination of the reference and the sample texts, R and S. Then what is the probability that such an author, writing a text of the same length as S, would purely by chance ...” • The principle here is simply that statistical results are more reliable when they’re based on more data.
Word Lists • The tests looked at so far are relatively crude from a literary point of view. Stylistic differences can be shown more sensitively by testing for authors’ usage of particular words rather than mere word lengths etc. • Signature provides a Word List facility (under the Wordlists menu). Select “Edit wordlists”, then click on “New List”, give your word list a name, then type into the Memo the words you want the list to contain, before clicking on “OK” (also indicate if you want your list to be case-sensitive). Now when you select any texts, they will if necessary be re-read, and a graph of the listed word occurrences displayed on the “Words” tab (see bottom-right corner of the screen).
Key Words • Signature’s key words facility can help you decide which words are most useful for author identification. To illustrate this, load the five Federalist Papers files provided, click on “Hamilton” and “Madison”, then select “Key words” from the Wordlists menu. A table will be generated showing the top 50 “keywords” that tell in favour of Hamilton (+ values), followed by the top 50 that tell in favour of Madison (– values). • Move down the list, control-clicking to select “upon”, “while”, “whilst” and “on”. Then click on the cyan label, and you’ll enter the word list facility with the chosen words already included. Use this to identify the true author of the “Unknown” Federalist Papers!
Other Features of Signature • The File menu enables you to read texts into multiple files (where “<DIV …>” tags are present), and to re-load texts (useful if editing has taken place meanwhile, or if loading was previously aborted for some reason). You can also “hide” texts to avoid cluttering the lists. • The View menu provides a text viewer into which texts can be read (at the cost of speed). This helps when defining an appropriate “filter” (also accessible through the View menu) for removing unwanted textual artefacts (e.g. HTML entities, or changing “Mr.” to “Mr” to avoid misidentification of sentence endings). • The Graphs and Tables menus provide a variety of formats for copying graphs/tables to the ClipBoard.