Download
1 / 1
10 likes | 73 Views
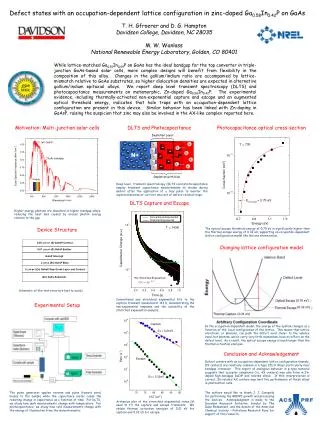
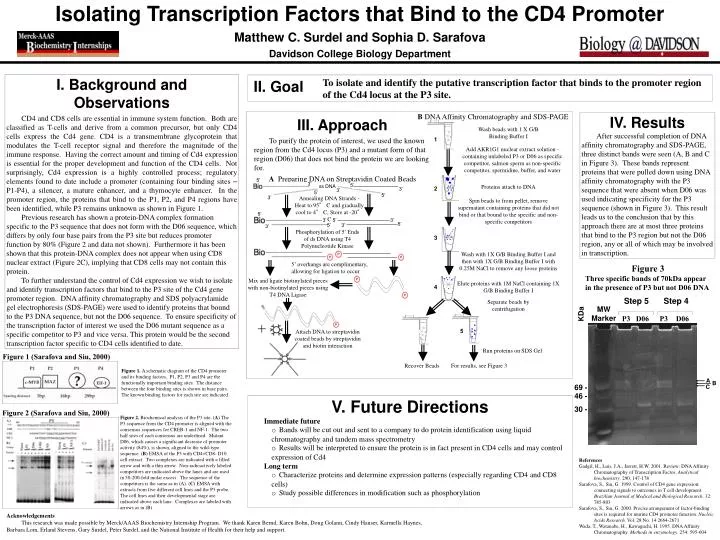
Isolating Transcription Factors that Bind to the CD4 Promoter Matthew C. Surdel and Sophia D. Sarafova Davidson College Biology Department. I. Background and Observations

E N D
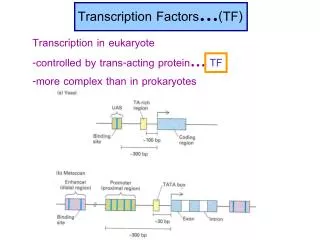
Isolating Transcription Factors that Bind to the CD4 Promoter Matthew C. Surdel and Sophia D. Sarafova Davidson College Biology Department I. Background and Observations CD4 and CD8 cells are essential in immune system function. Both are classified as T-cells and derive from a common precursor, but only CD4 cells express the Cd4 gene. CD4 is a transmembrane glycoprotein that modulates the T-cell receptor signal and therefore the magnitude of the immune response. Having the correct amount and timing of Cd4 expression is essential for the proper development and function of the CD4 cells. Not surprisingly, Cd4 expression is a highly controlled process; regulatory elements found to date include a promoter (containing four binding sites – P1-P4), a silencer, a mature enhancer, and a thymocyte enhancer. In the promoter region, the proteins that bind to the P1, P2, and P4 regions have been identified, while P3 remains unknown as shown in Figure 1. Previous research has shown a protein-DNA complex formation specific to the P3 sequence that does not form with the D06 sequence, which differs by only four base pairs from the P3 site but reduces promoter function by 80% (Figure 2 and data not shown). Furthermore it has been shown that this protein-DNA complex does not appear when using CD8 nuclear extract (Figure 2C), implying that CD8 cells may not contain this protein. To further understand the control of Cd4 expression we wish to isolate and identify transcription factors that bind to the P3 site of the Cd4 gene promoter region. DNA affinity chromatography and SDS polyacrylamide gel electrophoresis (SDS-PAGE) were used to identify proteins that bound to the P3 DNA sequence, but not the D06 sequence. To ensure specificity of the transcription factor of interest we used the D06 mutant sequence as a specific competitor to P3 and vice versa. This protein would be the second transcription factor specific to CD4 cells identified to date. II. Goal To isolate and identify the putative transcription factor that binds to the promoter region of the Cd4 locus at the P3 site. B DNA Affinity Chromatography and SDS-PAGE IV. Results After successful completion of DNA affinity chromatography and SDS-PAGE, three distinct bands were seen (A, B and C in Figure 3). These bands represent proteins that were pulled down using DNA affinity chromatography with the P3 sequence that were absent when D06 was used indicating specificity for the P3 sequence (shown in Figure 3). This result leads us to the conclusion that by this approach there are at most three proteins that bind to the P3 region but not the D06 region, any or all of which may be involved in transcription. III. Approach To purify the protein of interest, we used the known region from the Cd4 locus (P3) and a mutant form of that region (D06) that does not bind the protein we are looking for. A Preparing DNA on Streptavidin Coated Beads Wash beads with 1 X G/B Binding Buffer I 1 Add AKR1G1 nuclear extract solution - containing unlabeled P3 or D06 as specific competitor, salmon sperm as non-specific competitor, spermidine, buffer, and water 5’ 3’ 5’ ss DNA Proteins attach to DNA 2 3’ 3’ 5’ 5’ 3’ Annealing DNA Strands - Heat to 95° C and gradually cool to 4° C, Store at -20° C Spin beads to from pellet, remove supernatant containing proteins that did not bind or that bound to the specific and non-specific competitors 5’ 3’ 5’ 3’ 5’ 5’ 3’ 3’ Phosphorylation of 5’ Ends of ds DNA using T4 Polynucleotide Kinase 3 Wash with 1X G/B Binding Buffer I and then with 1X G/B Binding Buffer I with 0.25M NaCl to remove any loose proteins 5’ overhangs are complimentary, allowing for ligation to occur Figure 3 Three specific bands of 70kDa appear in the presence of P3 but not D06 DNA Mix and ligate biotinylated pieces with non-biotinylated pieces using T4 DNA Ligase Elute proteins with 1M NaCl containing 1X G/B Binding Buffer I 4 Step 5 Step 4 Separate beads by centrifugation MW Marker KDa P3 D06 P3 D06 + 5 Attach DNA to streptavidin coated beads by streptavidin and biotin interaction Run proteins on SDS Gel Figure 1 (Sarafova and Siu, 2000) Recover Beads For results, see Figure 3 Figure 1. A schematic diagram of the CD4 promoter and its binding factors. P1, P2, P3 and P4 are the functionally important binding sites. The distance between the four binding sites is shown in base pairs. The known binding factors for each site are indicated. A B 69 - C 46 - • V. Future Directions • Immediate future • o Bands will be cut out and sent to a company to do protein identification using liquid chromatography and tandem mass spectrometry • o Results will be interpreted to ensure the protein is in fact present in CD4 cells and may control expression of Cd4 • Long term • o Characterize proteins and determine expression patterns (especially regarding CD4 and CD8 cells) • o Study possible differences in modification such as phosphorylation 30 - Figure 2 (Sarafova and Siu, 2000) Figure 2. Biochemical analysis of the P3 site. (A) The P3 sequence from the CD4 promoter is aligned with the consensus sequences for CREB-1 and NF-1. The two half sites of each consensus are underlined. Mutant D06, which causes a significant decrease of promoter activity (84%), is shown, aligned to the wild-type sequence. (B) EMSA of the P3 with CD4+CD8- D10 cell extract. Two complexes are indicated with a filled arrow and with a thin arrow. Non-radioactively labeled competitors are indicated above the lanes and are used in 50-200-fold molar excess. The sequence of the competitors is the same as in (A). (C) EMSA with extracts from five different cell lines and the P3 probe. The cell lines and their developmental stage are indicated above each lane. Complexes are labeled with arrows as in (B). References Gadgil, H., Luis, J.A., Jarrett, H.W. 2001. Review: DNA Affinity Chromatography of Transcription Factos. Analytical biochemistry. 290, 147-178 Sarafova, S., Siu, G. 1999. Control of CD4 gene expression: connecting signals to outcomes in T cell development. Brazilian Journal of Medical and Biological Research. 32: 785-803 Sarafova, S., Siu, G. 2000. Precise arrangement of factor-binding sites is required for murine CD4 promoter function. Nucleic Acids Research. Vol. 28 No. 14 2664-2671 Wada, T., Watanabe, H., Kawaguchi, H. 1995. DNA Affinity Chromatography. Methods in enzymology. 254: 595-604 Acknowledgements This research was made possible by Merck/AAAS Biochemistry Internship Program. We thank Karen Bernd, Karen Bohn, Doug Golann, Cindy Hauser, Karmella Haynes, Barbara Lom, Erland Stevens, Gary Surdel, Peter Surdel, and the National Institute of Health for their help and support.