Download
1 / 14
140 likes | 147 Views
Authors: LaGrange College Undergraduates Tia Braxton, Melanie Chambers, Natalie Glass, Porter Law, Jaydon Parrish, Elijah Robertson, Payton Smith, Jason Timms Caleb Tyler, Andrew Valbuena, Ben Womack. Professor: John A. Tures.

E N D
Authors: LaGrange College Undergraduates Tia Braxton, Melanie Chambers, Natalie Glass, Porter Law, Jaydon Parrish, Elijah Robertson, Payton Smith, Jason Timms Caleb Tyler, Andrew Valbuena, Ben Womack. Professor: John A. Tures Factors Associated With Ex-Felon Voting Rates, State-Level Research Georgia State Senate Study Committee
Jason Timms Ex-Felon Voting ResearchUSA & Other Democratic Countries • The number of States and Democratic Countries that have great, little, or no voter disenfranchisement, vary greatly. • The data was collected from a variety of countries, ranging from Europe, Asia, Africa, and Australia. • There seems to be no link between a country being a democracy and the amount of voter disenfranchisement. Group 1 = Three countries (Australia, New Zealand, Taiwan) having strictly enforced disenfranchisement laws coming to 15.8 percent. Group 2 countries (U.K. Italy, France Netherlands) that have partial voting disenfranchisement coming to 21.1 percent. Group 3 = twelve countries (Ireland, Germany, Croatia, Czech Republic, Denmark, Finland, Latvia, Lithuania, Montenegro, Spain, Switzerland, Canada) that enforce no voting disenfranchisement coming to 63.2 percent.
Tia Braxton Ex-Felon Voting ResearchState Crime Rates • Is there a relationship between Ex-Felons being granted voting rights and crime rates? Crime Rates Measured by: Crime Rates by state per 100,000 population Results: There is a statistical relationship between higher crime rates per state and states that are harder on felons (not a strong one, but slightly significant).
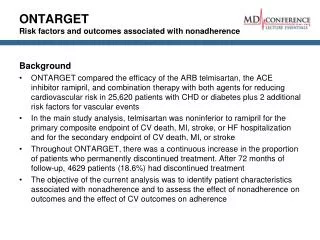
Ben Womack Ex-Felon Voting ResearchState-Level Recidivism • Researchers reviewed empirical data on recidivism rates and felon voting rights in different states in order to discover if there was a relationship between the two. • It was discovered that there is not a significant relationship between states allowing released felons to vote and recidivism rates. • It is also important to concede that only 8 of the 17 states, including D.C., that allowed felons to vote had reliable recidivism data available; thus, the sample size for group (B) was relatively small. In order to conduct a more accurate comparison, the definition of recidivism would need to be standardized nationally, and recidivism rates would need to be analyzed from the same years.
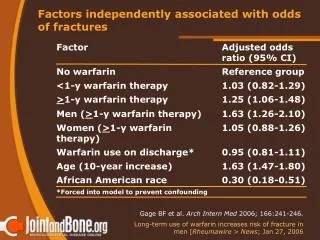
Natalie Glass and Professor John A. Tures Ex-Felon Voting ResearchBackground Checks / State-Level Corruption • Is Restoring Voting Rights For Ex-Felons Associated With State-Level Corruption? • State-Level Corruption: Measured As • State Politicians Convicted Per Capita, Ranking • Assessment Of State Anti-Corruption Laws • Results: • Neither Measure of Corruption Was Associated With Reestablishing Ex-Felon Voting Rights Are Tougher Background Checks Associated With Ex-Felon Voting Rights? • Some states have lenient background checks (up to 7 year searches) while others are more stringent on background checks (7+ years) • Results: • Whether a state was tougher or more lenient on background checks are unrelated to whether or not that state reestablishes Ex-Felon Voting Rights
Caleb Tyler Ex-Felon Voting ResearchVoter Fraud • The states with the highest voter fraud per capita was Minnesota (2.94), Iowa (1.79), and Mississippi. (1.36). Minnesotans have their vote restored after prison, parole, and probation. Iowans may lose their vote permanently. Mississippians also may lose their right to vote permanently. The lowest amount of voter fraud per capita was in Vermont, Rhode Island, and Delaware, all of which had 0 cases per capita. Rhode Island restores voting rights after prison. Vermont and Maine have no voting restriction laws. • A second test looks that the binary measure of voting rights for ex-felons, and tests both categories on voter fraud. Overall, the states with the tougher measures against ex-felons are a little more likely, on average, to have cases of voter fraud. The relationship is statistically significant at the 90% threshold. • Data for voting fraud comes from the Heritage Foundation. Data for ex-felon voting rights comes from the National Conference of State Legislatures (NCSL).
Payton Smith Ex-Felon Voting ResearchBarriers To Voting • There is a relationship between voting barriers and voter turnout rates in United States general elections. • Voting barriers were significantly more likely to be a drag on voting turnout in 2010, but less so in 2018. • Overall, voting barriers were also unrelated to the barriers ex-felons face in trying to get their voting rights back. • States in Red = Voting Restrictions Passed (2010- )
Jaydon Parrish Ex-Felon Voting ResearchImpact Upon Elections • Research: • An increase in legislation granting nonviolent offenders increased voting rights could increase voter turnout rates on the state level. • Amount of disenfranchised offenders per state • Potential percent increase of voting eligible population if all offenders could vote. • Results: There is a positive relationship between allowing felons to vote, and an increase in the voter turnout rate to the point in which it could have potentially altered the results of the 2016 General Election. • FL, MI, MN, NH, WI are swing states worth 69 electoral college points
Andrew Valbuena Ex-Felon Voting ResearchIdeological Voting • Are Conservative States less likely to grant Non-Violent Felony offenders the right to vote? • Data on States • Gallup Polling on State Ideology • NCSL on Non-Violent Felony Offenders Voting Rights Results • Conservative States are more likely to not grant Ex-Felony Offenders the right to vote https://news.gallup.com/poll/226730/conservative-leaning-states-drop.aspx
Porter Law There is a relationship between states’ political support affecting a state of allowing nonviolent felony offenders to vote. Trump states were more likely to support restrictions on ex-felons voting. Ex-Felon Voting ResearchPolitical Party Voting
Elijah Robertson Ex-Felon Voting ResearchGroup Voting: Age, Gender, Ethnicity, Party • I researched whether groups differ in their support of ex-felon voting rights by looking a St. Petersburg Poll from 2018, during a ballot measure that would give ex-felons the right to vote. • Democrats supported this more than Republicans • Age was not a significant factor. Younger people were more likely to support the measure giving ex-felons the right to vote, but it was not a big difference. Even a majority of old people backed this ballot measure.
Elijah Robertson Ex-Felon Voting ResearchGroup Voting: Age, Gender, Ethnicity, Party • Men and women supported the Florida measure that gave ex-felons the right to vote, both by a solid majority. • African-Americans were the most supportive of the measure to grant ex-felons the right to vote. Majorities of Whites and Hispanics (55%+) backed the measure to give ex-felons the right to vote. Less than half of Asian-Americans supported it. • The measure (Amendment 4) passed Florida by a margin of 64.5%-35.5%.
Melanie Chambers & Professor John A. Tures Ex-Felon Voting ResearchRole of Religion • Are religious people more likely to be tougher on ex-felons (punitive) or more likely to be lenient toward ex-felons (rehabilitative)? • Examination of Pew Research Center Survey Of Percentage of Religious People Per State • States which have more religious people are more likely to be tougher on ex-felons in terms of restricting their voting rights. https://www.pewresearch.org/fact-tank/2016/02/29/how-religious-is-your-state/?state=alabama
Professor John A. Tures Ex-Felon Voting ResearchConclusion • Restoring Rights Could Be A Political Issue • Restricting Voting Rights Of Ex-Felons Occurs In States With More • Conservative Voters • Republican Voters • Religious Residents • Restoring Rights Would Affect Few Elections, But It Would Matter In Close States and Close Elections. • In Florida, Restoring Those Ex-Felon Voting Rights Was Supported By A Majority Of Men, Women, All Ages, All Ethnicities Except Asian-Americans. • No Measure Shows A Strong Reason Why Ex-Felons Should Not Have Their Voting Rights Restored. • States Which Restore Voting Rights Have • Somewhat Lower Crime Rates • Slightly Less Voting Fraud • No Difference In … • Recidivism Rates • State-Level Corruption • Other Voting Barriers • Background Checks • …Than States Which Do Not Restore These Voting Rights To Ex-Felons