Download
1 / 38
380 likes | 385 Views
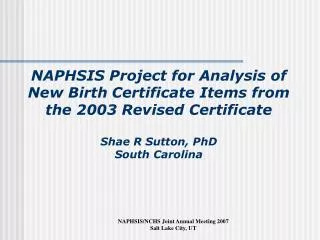
Environmental Factors and Risk of Childhood Obesity Sharon Kandris, MA 1 & Gilbert Liu, MD,MS 2 1 The Polis Center at Indiana University-Purdue University at Indianapolis 2 Children’s Health Services Research, Department of Pediatrics at Indiana University. Background.

E N D
Environmental Factors and Risk of Childhood ObesitySharon Kandris, MA1 & Gilbert Liu, MD,MS21 The Polis Center at Indiana University-Purdue University at Indianapolis2 Children’s Health Services Research, Department of Pediatrics at Indiana University
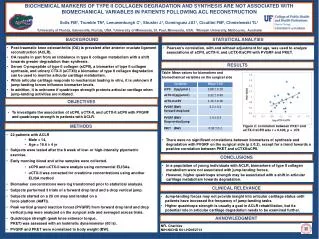
Background • Environmental factors that increase caloric intake and decrease energy expenditure seem to underlie the rapid increases in obesity prevalence • The current U.S. environment is characterized by an essentially unlimited supply of convenient, inexpensive, palatable, energy-dense foods coupled with a lifestyle requiring negligible amounts of physical activity for subsistence.
Background 1970’s obesity was associated with higher socioeconomic status in early childhood, and lower SES in adolescent females 1980’s very disparate reporting on the relationship between SES and obesity 1990’s 2.2-fold increased incidence of childhood obesity in children living in dilapidated living conditions. 2000’s children from low income families had an almost threefold increased risk of developing obesity.
Hypothesis Controlling for individual demographics, childhood obesity is more prevalent in regions where the social milieu does not support healthy lifestyles
Approach • Study design: Cross-sectional • Regenstrief Medical Record System, Indiana University Medical Group • Patients ages 4-18y who had simultaneously documented heights and weights in calendar years 1996 – 2000 • Categorized by BMI percentiles into overweight (>85th – 95th percentile for age-adjusted norms) and obese (>95th percentile) • Using GIS, we linked study subjects with community-level socioeconomic data (2000 U.S. Census) using census block groupsas the index
Statistical Analysis Logistic regression examining association between obesity and: Individual-level variables • Age • Gender • Ethnicity Community-level variables • Median family income • Extremely low, Very low, Low, Middle, Moderate & Upper* • Proportion of adults without HS degree • Proportion of single-parent households • Crime rate per square mile • Linguistic isolation *[HUD definitions adjusted for Indianapolis median family incomes]
Distribution of BMI (n=17,871) Normal weight……………..11,133 (62%) Overweight………………….2,893 (16%) Obese………………………..3,845 (22%)
Black (%) White (%) Hispanic (%) Other (%) Male Normal Overweight Obese 3246 (65) 734 (15) 1021 (20) 1820 (63) 450 (16) 620 (21) 198 (54) 76 (21) 94 (16) 132 (67) 36 (18) 28 (14) Female Normal Overweight Obese 3396 (60) 996 (17) 1302 (23) 2041 (63) 519 (16) 660 (21) 185 (57) 55 (17) 82 (26) 115 (64) 27 (15) 38 (21) Distributions of BMI by Ethnicity and Gender (n=17,871)
Point Estimates and 95% Confidence Intervals for Odds Ratios by Ethnicity and Gender Factor Estimate 95% Confidence Interval Ethnic and Gender Subgroups White Male White Female Hispanic Male Hispanic Female Black Male Black Female Others Male Others Female 1.000 0.931 1.374 1.437 0.955 1.059 0.654 1.097 Reference Group (0.822, 1.055) (1.050, 1.799) (1.114, 1.852) (0.852, 1.070) (0.948, 1.184) (0.433, 0.987) (0.756, 1.592)
Factor Estimate 95% Confidence Interval Income categories Extremely low income Very low income Low income Moderate income Middle income Upper income 1.441 1.550 1.471 1.345 1.335 1.000 (1.104, 1.881) (1.265, 1.898) (1.212, 1.785) (1.078, 1.677) (1.071, 1.664) Reference Group Point Estimates and 95% Confidence Intervals for Odds Ratiosby Income Levels
Summary of Findings • Inverse association between the median family income of a census block group and the incidence of obese children in the census block group • A child’s risk of obesity differs according to individual characteristics such as age, race and gender.
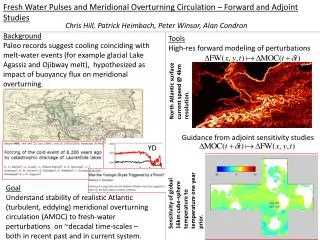
Spatial Analysis • Used Geographic Information Systems (GIS) • Observed spatial relationship between obesity and environmental variables • Compared block groups with high prevalence of obesity to those with low and mapped against environmental variables • Identified “High-Risk” Areas
High RiskNeighborhoods In General: • Near Industry • Poor Access to Open Space • Few Grocery Stores • Impoverished • Large Hispanic population
Next Steps Develop Education and/or Intervention Strategies Through Continued Involvement in Community Initiatives • P.E. for the 21st Century Charter School, Indianapolis, IN • Youth Movement Initiative
Community Initiatives National • Pediatric Academic Societies • American College of Sports Medicine • National Association of State High School Associations Local • Strategic Thinking on Obesity Coalition • West Side Community Organization • Additional Funding Support (NIH) • Indiana State Department of Health • State Toxicologist • Local Researchers
Contact Us Sharon Kandris skandris@iupui.edu 317.278.2944 Gil Liu gcliu@iupui.edu 317.278.0552