Download
1 / 50
500 likes | 608 Views
The Latest on La Niña, MJO and Its Impact on Recent Front Range Weather and the March-April-May 2012 Outlook For Colorado . Mike Baker National Weather Service Boulder, Colorado February 25, 2012. Pacific Jet Stream. La Niña Nearing Its End. Colder than

E N D
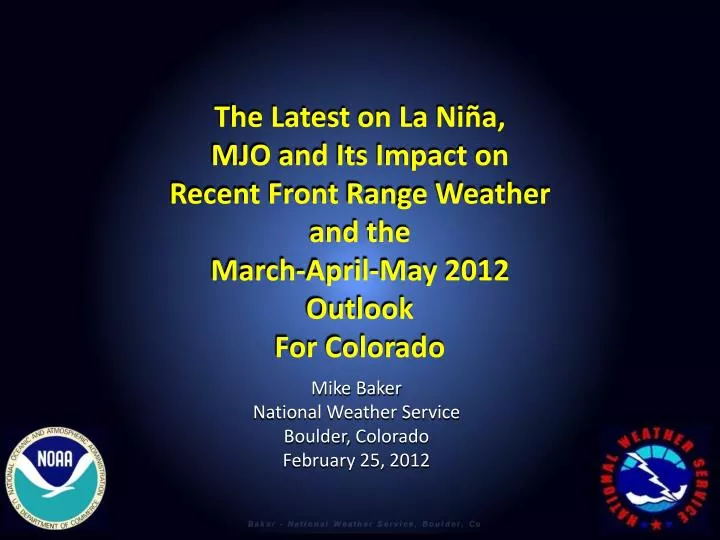
The Latest on La Niña, MJO and Its Impact on Recent Front Range Weather and the March-April-May 2012 Outlook For Colorado Mike Baker National Weather Service Boulder, Colorado February 25, 2012
Pacific Jet Stream La Niña Nearing Its End Colder than Average Ocean Warmer than Average Ocean
During the past 90 days, oceanic and atmospheric circulations in the tropical Pacific Ocean indicated the presence of a weak to moderate La Niña. These circulations include low-level easterly and upper-level westerly wind anomalies and an enhanced westerly sub-surface ocean current that extended across the equatorial Pacific Ocean. The combined circulation promoted upwelling along the west coast of South America causing sea waters to cool which subsequently suppressed convective rainfall (i.e., thunderstorm development) over the tropical eastern Pacific, and downwelling that warmed sea waters in the tropical western Pacific which enhanced deep convection and rainfall in this part of the world.
Western Pacific Central Pacific Eastern Pacific In the past 30 days, however, negative surface and subsurface water temperature anomalies decreased (an indication of warming) in the eastern tropical Pacific Ocean, in some areas by as much as 1 to 2 deg C (based on the 1971-2010 SSTA average). The recent warming in the eastern Pacific Ocean may be attributed to a moderate to strong Madden-Julian Oscillation (MJO) that propagated across the Pacific basin during this 30-day period. In the central equatorial Pacific Ocean, water temperatures remained essentially unchanged, but its spatial coverage has reduced in size as it continues to slowly migrate westward. These changes in sea water temperature are an indication that La Niña is weakening.
Suppressed Convection The MJO (also called known as the 30-60 Day Tropical Wave) is a combination of large-scale circulations associated with an oceanic Kelvin Wave and atmospheric Rossby Wave. MJOs of at least moderate strength will circle the globe along the equator ordinarily within a span of 30 to 60 days. MJOs are characterized by an eastward propagating complex of enhanced and suppressed tropical convective rainfall observed mainly over the Indian and Pacific Oceans. MJOs moving across the central and eastern tropical Pacific Ocean can have a significant influence on precipitation and circulation patterns as far north as Hawaii and the continental United States. Weather patterns and large scale circulations generated by the passing MJO may resemble those observed during moderate to strong El Niños, but their life span is much shorter (ranging from a few days to a couple weeks.) MJOs form most often during weak La Niñas and ENSO-neutral conditions and are weakest or absent during El Niño events.
Late in January, such a MJO formed in the western tropical Pacific Ocean near Indonesia where it remained almost stationary for several days. Early in February, the MJO quickly strengthened and began to propagate eastward across the western tropical Pacific, enhancing low-level easterly wind anomalies in advance of the oscillation and weakening or even reversing the easterly wind anomaly in its wake. The resulting upward air motion produced by converging low-level winds and diverging winds aloft enhances convective rainfall in the vicinity of the MJO. During the next several days, the MJO continued to move east along the equator, reaching the northwest coast of South America by the middle of February. Arrival of the MJO suppressed upwelling along the coast of South America which warmed surface waters and subsequently enhanced convective rainfall and thunderstorm development over the eastern tropical Pacific Ocean.
The Latest Oceanic Niño Index - ONI • The ONI is based on sea surface temperature (SST) departures from average in the Niño 3.4 region of the eastern tropical Pacific Ocean. It is the principal measure used by NOAA’s Climate Prediction Center (CPC) for monitoring, assessing and predicting El Niño/Southern Oscillation (ENSO.) • ONI is defined as the three-month running-mean SST departures in the Niño 3.4 region. • ONI is used to place current ENSO and non-ENSO events into a historical perspective. • CPC’s operational definitions of El Niño and La Niña are keyed to the ONI index. An ONI of -0.9 during the 3-month climate season of NOV-DEC-JAN 2011-2012 indicates the presence of a weak to moderate La Niña.
Niño Regions in the Equatorial Pacific Ocean Mexico Focus Region Peru Australia Niño 3.4 – The principal region in the eastern Equatorial Pacific Ocean used by the Climate Prediction Center (CPC) for monitoring, assessing and predicting ENSO (hatched region on the above map) .
Moderate to Strong La Niña Weak to Moderate La Niña As of February 15, 2012 the weekly SST anomaly for Niño 3.4 was -0.9C. One year ago, the SST anomaly for Niño 3.4 was -1.3C. Weekly SST anomalies in Niño 3.4 have remained nearly constant during the past four weeks.
Jet Streams and Prominent Weather Patterns Across the Western U.S. January to Mid-February 2012
A channel of strong winds within the westerly wind belt (30-60˚ N latitude) Produced and sustained by large pressure and temperature gradients between the poles and the equator Can be thousands of miles in length, hundreds of miles wide, and thousands of feet in depth Typically found between 25,000 and 40,000 feet above sea level and occasionally below 25,000 feet AGL during the winter season Core (or central) wind speeds may exceed 180 mph Its position in relation to latitude can change significantly from week-to-week and even from day-to- day Much of the variability in precipitation, temperature and wind we see, especially during the winter and spring, can be attributed to the jet stream. The Pacific Jet Stream t e S J t r c e i i f a c m a P 300mb Mean Vector Wind Composite
During the first half of January, an abnormally strong upper level high pressure ridge sat over the west coast of the continental U.S. This diverted the Pacific jet stream (i.e., storm track) northward over western Canada. The result was unseasonably warm and dry conditions across much of the western U.S., including the Pacific Northwest and Colorado.
During the second half of January, the west coast ridge continued to weaken. This allowed the powerful Pacific jet stream to shift southward over the Pacific Northwest and northern Rocky Mountain states where it merged with its colder counterpart, the Polar Jet stream. Relatively warm and very moist maritime air transported by the Pacific jet stream and bitter cold air brought down from Alaska by the Polar jet stream converged over the Pacific Northwest. The result was several days of record setting rainfall and snowfall across the region. Extensive flooding also occurred along the coast and inland river valleys of Washington. Days later, this powerful storm system moved inland, eventually battering western Wyoming and northwestern Colorado with record breaking snowfall and fierce winds on the 18th of January. Winds were clocked to 100 mph winds on many of the high mountain passes creating treacherous blizzard conditions. The Park and Gore Ranges in northwest Colorado saw snow pile up to over a meter deep, signally a dramatic end to the region’s snow drought. East of the Continental Divide, the passing jet stream and a large drop in air pressure following the passage of a strong Pacific cold front produced damaging downslope winds that extended as far east as the Kansas border. Winds gusted to over 100 mph in the Colorado Front Range mountains, while the high plains remained quite dry. All and all--a classic wintertime La Niña pattern.
In early February, the Pacific jet stream over the western U.S. continued to buckle southward with pressure and height falls over the eastern Pacific Ocean due to the approaching Madden-Julian Oscillation (MJO). On the 3rd of February, a large, sharply curved low pressure trough formed over the central Rocky Mountain region centered on a deepening upper level cyclone over the Four Corners area. The cyclone continued to strengthen as a subtropical jet stream funneled relatively warm and very moist tropical air northeastward from an expanding complex of deep convection along the equator. Warming sea surface waters ahead of the MJO helped to enhance this convection now over the east-central Pacific region known as Niño 3.4. On the 3rd and 4th of February, very moist tropical air continued to stream northward into the deepening low pressure system moving very slowly across Colorado and northern New Mexico. Strong circulation around this area of low pressure funneled much of his moisture into northeast Colorado resulting in moderate to heavy snowfall that lasted for nearly 48 hours.
By the second week of February, a split in the Pacific jet stream sent some of its momentum (energy) northward over western Canada and the remainder of its momentum southward over the southwest U.S. and Mexico. By this time the MJO and its deep convection had propagated east of Nino 3.4, however, a new area of tropical convection had formed with a strong Rossby Wave passing just south of the Hawaiian Islands. Flow ahead of this Rossby Wave directed another stream of moist tropical air northward over the southwest U.S. Some of this moisture rich air found its way over eastern Colorado where it fueled additional snowfall over a period of several days.
The Influence of MJO On Colorado Front Range Weather In February A deep low pressure trough carved out by a strong Pacific jet stream diving down the west coast, cold air from the north, and a steady flow of moist tropical air carried northward by the subtropical jet stream set the stage for one of the snowiest Februarys on record for the Front Range and adjacent high plains of northeast Colorado. The abnormally cold and snowy conditions observed during the first couple of weeks of February were in sharp contrast to the unseasonably warm, dry and windy conditions experienced during December and most of January; weather conditions synonymous with La Niña.
From the 3rd to the 16th of Feb 2012, snow fell on and near the Colorado Front Range on 10 separate days. The greatest snowfall occurred over a two-day period, Feb 3rd and 4th, when over three feet of snow buried portions of the Front Range, with up to two feet of heavy wet snow accumulating at the base of the Front Range--including the Denver metro area and Fort Collins. An intense low pressure system tracking very slowly across southeast Colorado coupled with a steady inflow of moist tropical air are believed to be responsible for snow totals rarely seen along the Front Range during what is normally one of the least snowiest months of winter.
0545Z 02-10-12 2345Z 02-09-12 1445Z 02-09-12 MJO MJO MJO 2345Z 02-10-12 1145Z 02-10-12 1745Z 02-10-12 Water vapor satellite images from 1445z Thu Feb 09 to 2345Z Sat Feb 11 2012. MJO MJO MJO 2345Z 02-11-12 1745Z 02-11-12 1145Z 02-11-12 MJO MJO MJO Moist and unstable air continued to stream north into the Rocky Mountain region from a complex of tropical convection south of the Hawaiian Islands during the 2nd week in Feb. This influx of moisture rich air helped to produce more snow along the Colorado Front Range.
The next greatest snowfall in February along the Front Range happened on the 7th and 8th. Up to a half foot of snow fell on the Interstate 25 urban corridor, including the Denver metro area, with up to a foot (in some areas more) of snow in the Front Range foothills. Lighter snowfall was observed on the 11th, 12th, 13th, 15th and 16th with a series of Canadian cold fronts racing across the region. Deep convection in tropical eastern Pacific continued to fuel this precipitation, but over time, the connection to the tropics was broken, putting an end to this pattern of snowfall for the Front Range.
Temperature, Precipitation, and Drought Conditions Across Colorado During the 90-Day Period November 19, 2011 to February 16, 2012
For the 90-day period ending February 16, 2012, precipitation across Colorado ranged from a deficit of around 5 inches in the Upper Yampa River Basin in northwest Colorado to a surplus of slightly more than 2 inches in the far southeast corner of the state. Overall, precipitation amounts were below normal west of the Continental Divide, and average to above average east of the Divide. Two days of continuous snowfall (heavy at times) in early February and three additional periods of snowfall in early November and early and mid December of 2011, were largely responsible for the precipitation surplus indicated along Colorado Front Range.
During this same 90-day period, precipitation ranged from 50 to 100 percent of normal on Colorado’s western slope. Across northwest Colorado, precipitation continued to run well below average, as little as 5 to 10 percent of average in parts of Moffat, Routt, Jackson and Grand Counties. For eastern and south central Colorado, precipitation generally ran near to above average. However, precipitation totals for parts of northeast Colorado, including the Front Range urban corridor and the southeast plains near the Kansas and Oklahoma borders, ranged from 150 to slightly over 300 percent of normal.
The Standardized Precipitation Index (SPI) forthe 90-day period ending February 16, 2012, continued to indicate very dry to extremely dry soil conditions in the Upper Yampa River Basin in northwest Colorado and head water region of the Colorado River Basin in north central Colorado. Soil conditions for the remainder of western Colorado varied from near normal to moderately dry. For eastern and south central Colorado, soil conditions varied from near normal to moderately wet, with the exception of very wet conditions along the Front Range near Denver and the southeast corner of the state. The SPI was developed to monitor potential short term agricultural and long-term hydrological drought conditions. The SPI is a probability index that considers only precipitation.
Temperature, Precipitation, and Drought Conditions Across Colorado During the 30-Day Period January 18, 2011 to February 16, 2012
During the 30-day period ending February 16, 2012, precipitation across Colorado varied from around 2 inches below normal in the upper Yampa and White River Basins in northwest Colorado, to approximately 2 inches above normal for portions of the South Platte River Basin in northeast Colorado. Heavy snowfall over a two day period in early February was a principal reason for the large surplus in precipitation along northern Colorado’s Front Range.
The Standardized Precipitation Index (SPI) forthe 30-day period ending February 16, 2012, indicated moderate to very dry conditions in the Upper Yampa River Basin in northwest Colorado and along the Purgatoire River and its drainage basin in southeast Colorado. Moderate to very wet conditions were mainly found across northeast Colorado. Soil moisture content for the remainder of the state was generally near normal.
Temperature across Colorado continued to run above average for most of the state during the 30-day period ending February 16, 2012. The greatest positive temperature departures were observed across northwest Colorado. The greatest negative temperature departures were observed in the San Luis Valley in south Colorado and parts of northeast and east central Colorado.
A significant change in the jet stream pattern over the western U.S. from mid-January to early February caused a dramatic change in the distribution of precipitation across Colorado as noted earlier in this presentation. Cold and snowy conditions across northwest and west central Colorado around the middle of January quickly turned drier and warmer early in February. Whereas the unseasonably dry and mild conditions in eastern Colorado turned sharply wetter (snowier) and cooler with snowfall occurring on several days during the first two weeks of February. Northeast Colorado possibly experienced the greatest overall change in precipitation during this period.
As of February 24, 2012, the snow-water equivalent for Colorado was 79 percent of average. On Colorado’s western slope, snow-water equivalents ranged from 75 percent of average in the Colorado River Basin, to 79 percent in the San Migual, Dolores, Animas and San Juan River Basins in southwest Colorado. On the state’s eastern slope, equivalents were slightly better, with 90 percent of average in the South Platte River Basin and 87 percent of average in the Arkansas River Basin. The Upper Rio Grande Basin in south central Colorado wasn’t too far off with a snow-water equivalent of 85 percent of average.
From January 24 to February 24, 2012, the snow-water equivalent across Colorado increased an average of 5 percent. The largest change during this period occurred across the northern half of the state, with the Yampa and White River Basins in northwest Colorado leading the way with an average change of +11 percent, with the South Platte River Basin not far behind at +9 percent. Slight increases in snow-water equivalent were recorded in the Upper Colorado, Gunnison and Arkansas River Basins. The southwest corner of the state witnessed a slight decrease in snow-water equivalent during the period.
A Look Ahead to the Next Three Months Using ENSO-Climate Models, Historical Trends and Temperature and Precipitation Outlooks Prepared by the Climate Prediction Center
The Outlook for La Niña A majority of the dynamical and statistical ENSO (El Niño-Southern Oscillation) climate models predict an end to the weak to moderate La Niña in the Pacific Ocean by the end of the March-April-May climate season, then ENSO-neutral conditions through at least the summer of 2012. NCEP’s Coupled System Forecast V2 Model (NCEP CFSv2) predicts an earlier demise to La Niña during the February-March-April climate season. updated 15 Feb 2012
The Historical Distribution of Temperature and Precipitation In Colorado Relevant to El Niño, La Niña and ENSO-Neutral Conditions
Interpreting ENSO Box and Whisker Plots Diagram A is a map of the four climate mega-divisions in Colorado used by the Climate Prediction Center (CPC)—Divisions 046, 047,048 and 099. CPC has produced 3-month historical temperature and precipitation distribution plots for the three different ENSO categories –El Niño, La Niña and ENSO-neutral (non-ENSO) conditions for every climate mega-division in the United States. Diagram A Diagram B is a description of the ENSO box and whisker analysis plot used by CPC to represent historical temperature and precipitation distributions for each ENSO category pertaining to each climate division. The red line inside the ENSO box represents the mean or 50th percentile of the data (temperature or precipitation) distribution for each climate division. Approximately 34% of the total observations exist within the ENSO box, and the remaining observations (about 66%) lie outside of the box along the whiskers extending above and below the box. Diagram B
ENSO Box and Whisker Analysis Plots for the Northeast Colorado Climate Division #046 for the 3-Month Season March-May Precipitation for northeast Colorado has been slightly above average during El Niños, slightly below average for ENSO-neutral conditions, and below average during La Niña episodes. Temperatures for northeast Colorado have historically been slightly below average during El Niño events, near average during ENSO-neutral conditions, and average for La Niña events during this three-month period.
ENSO Box and Whisker Analysis Plots for the Southeast Colorado Climate Division #047 for the 3-Month Season of March-May Temperatures for southeast Colorado for March-April have historically been slightly below average for El Niño episodes, and near to slightly above average for ENSO-neutral conditions and La Niña events. For the same three-month period, precipitation has been slightly above average for El Niños, slightly below average for ENSO-neutral conditions, and below average during La Niña events.
ENSO Box and Whisker Analysis Plots for the Western Colorado Climate Division #048 for the 3-Month Season of March-May Temperatures in western Colorado during the months of March, April and May have been near average for El Niño events, slightly above average during ENSO-neutral conditions, and slightly below average for La Niña events. Finally, precipitation has historically been near average during El Niño events and ENSO-neutral conditions, and below average during La Niñas. Keep in mind, these distributions do not take into consideration the strength of these ENSO categories.
How Unusual Are The Recent Strong Winds Along the Colorado Front Range? It is not uncommon to see strong and very gusty downslope winds along the Front Range, especially during the winter. In the Boulder, Colorado area, high winds (winds of at least 70 mph) have happened most often during strong La Niña events (25 percent of the time) and moderate El Niño events (18 percent of the time), followed by moderate La Niñas (15 percent of the time) during the past 41 years (1969-2010.) High winds have occurred less often in the Boulder area during weak El Niño and weak La Niña events (7 percent and 9 percent of the time, respectively). The verdict isn’t in yet for this winter season, but one would think this has been one of the windiest winters in many years. Baker 2011 High Wind Days – A day when the speed of a sustained wind or wind gust equals or exceeds 70 mph.
As La Niña continues to weaken during the next few weeks, the western U.S. should see a jet stream and weather pattern normally associated with La Niña. This includes a strong and persistent high pressure ridge along the west coast and a strong jet stream flow extending from the Pacific Northwest to central Rocky Mountains and southern Great Plains. Waves of moist and relatively cold maritime air are likely to race southeast along this river of strong winds aloft, producing periods of extensive cloud cover, snowfall (possibly heavy) and strong, gusty winds in northwest and north central Colorado. This same jet stream pattern is also likely to produce episodes of strong and gusty downslope winds and abnormally warm and dry condition east of the mountains. However, one can not rule out the possibility of a few fast moving cold fronts capable of brief heavy snowfall and strong northerly winds for the state’s northeast plains and Palmer Divide. Upper Level Trough Upper Level Ridge Baker NWS Boulder Precipitation Swath Storm Track Dry & Windy Dry & Windy Precipitation Swath Baker NWS Boulder
Early May Seasonal Migration of the Jet Stream Late Feb. During the next couple of months, the Pacific jet stream (i.e., storm track) will make its usual northward migration with the lengthening daylight, shifting from its current mean position over the central Rocky Mountain region to the plains of central Canada by May. For Colorado, this means fewer winter-like storms, lighter winds and steadily warmer and drier conditions in the weeks to come. For the Front Range and northeast plains of Colorado, this could mean an increase in the potential for wildland fire.
And… the Colorado Front Range is no stranger to wildland fire.
March- May 2012 Temperature and Precipitation Outlook for Colorado Issued by NOAA’s Climate Prediction Center
March 2012 Temperature Outlook for Colorado The March temperature outlook for Colorado from the Climate Prediction Center calls for a 33.3 to 40 percent chance for above average temperatures roughly west of the Continental Divide, a 40 to 50 percent chance for warmer than average temperatures for areas generally east of the Divide, with the highest odds (50-60 percent chance) for above average temperatures along the state’s eastern border.
March 2012 Precipitation Outlook for Colorado The March outlook for Colorado calls for a 33.3 to 40 percent chance of below average precipitation for the entire state, except for the southwest and south central sections where the outlook is calling for a 40 to 50 percent chance of below average precipitation.
March-May 2012 Temperature Outlook for Colorado The temperature outlook for the three-month period March-May calls for a equal (or undeterminable) chance for above, below and near average temperatures (labeled EC) across the northern third of Colorado. The outlook also calls for a 33.3 to 40 percent chance for above average temperatures for the remainder of Colorado, except for the extreme southwest tip of the state where there is a 40 to 50 percent chance of above average temperatures.
March-May 2012 Precipitation Outlook for Colorado Finally, CPC’s outlook for Colorado calls for a 33.3 to 40 percent chance of below average precipitation for the northern third of the state and a 40-50 percent chance of below average precipitation for the lower two-thirds of Colorado.
Summing It Up • La Niña continues to weaken in the Pacific Ocean. Surface and sub-surface water • temperature anomalies in the eastern tropical Pacific Ocean have decreased and will • likely continue to do so in the coming months. • The recent decline in La Niña may be linked to large scale oceanic and atmospheric • circulations and anomalous warming produced by a moderate to strong Madden-Julian Oscillation (MJO) that propagated eastward across the tropical Pacific Ocean in late January and early February. • The movement of the MJO across the eastern Pacific Ocean may account for the relatively sudden shift from unseasonably warm and dry conditions across Colorado and the western U.S. in December and early January, to the unseasonably cool and moist (snowy) conditions across the southwest and central Rocky Mountain regions of the U.S. from late January to mid-February. Conditions normally attributed to La Niña were replaced with those commonly associated with El Niño. • With the MJO weakening as it moves east across northern Africa and over the Indian • Ocean, the jet stream and weather patterns across the western U.S. should return to • those commonly associated with a La Niña. However, as this La Niña weakens, so • will its influence on weather patterns affecting the U.S. • The outlook for Colorado issued by the Climate Prediction Center for the March-May • climate season is calling for at least a one-in-three chance of above average temperatures • and below average precipitation across the entire state.