Download
1 / 52
520 likes | 526 Views
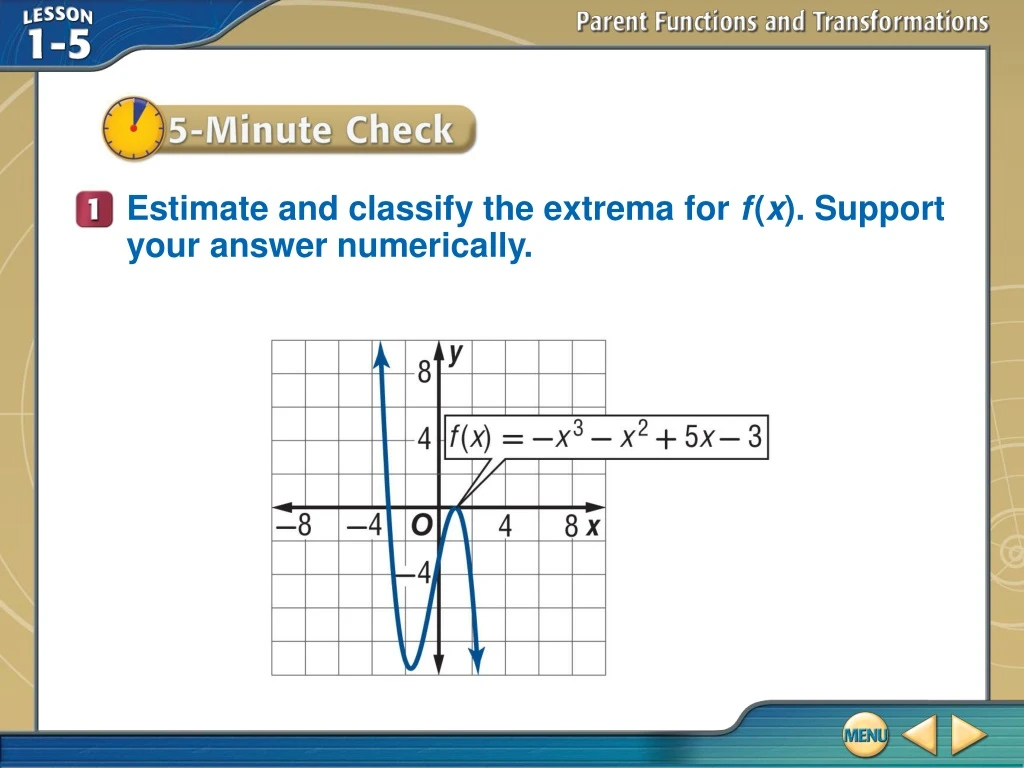
Estimate and classify the extrema for the function f(x). Provide numerical support for your answer.

E N D
Estimate and classify the extrema for f(x). Support your answer numerically. 5–Minute Check 1
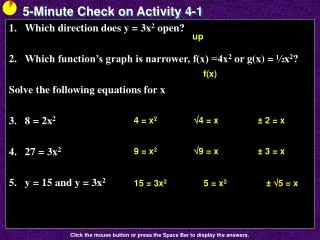
A. B.5 C. D.13 Find the average rate of change of f(x) = 3x3 – x2 + 5x – 3 on the interval [–1, 2]. 5–Minute Check 3
A. B.5 C. D.13 Find the average rate of change of f(x) = 3x3 – x2 + 5x – 3 on the interval [–1, 2]. 5–Minute Check 3
parent function • constant function • zero function • identity function • quadratic function • cubic function • square root function • reciprocal function • absolute value function • step function • greatest integer function • transformation • translation • reflection • dilation Vocabulary
Describe the following characteristics of the graph of the parent function : domain, range, intercepts, symmetry, continuity, end behavior, and intervals on which the graph is increasing/decreasing. Describe Characteristics of a Parent Function Example 1
The domain of the function is, and the range is . Describe Characteristics of a Parent Function The graph of the reciprocal function shown in the graph has the following characteristics. The graph has no intercepts. The graph is symmetric with respect to the origin, so f(x) is odd. Example 1
The end behavior is as The graph is decreasing on the interval and decreasing on the interval . Describe Characteristics of a Parent Function The graph is continuous for all values in its domain with an infinite discontinuity at x = 0. Example 1
Describe Characteristics of a Parent Function Answer: Example 1
Answer:D and R: no intercepts. The graph is symmetric about the origin, so f(x) is odd. The graph is continuous for all values in its domain with an infinite discontinuity at x = 0.The end behavior is as The graph decreases on both intervals of its domain. Describe Characteristics of a Parent Function Example 1
Describe the following characteristics of the graph of the parent function f(x) = x2: domain, range, intercepts, symmetry, continuity, end behavior, and intervals on which the graph is increasing/decreasing. Example 1
A. D: , R: ; y-intercept = (0, 0). The graph is symmetric with respect to the y-axis. The graph is continuous everywhere. The end behavior is as , and as , . The graph is decreasing on the interval and increasing on the interval . B. D: , R: ; y-intercept = (0, 0). The graph is symmetric with respect to the y-axis. The graph is continuous everywhere. The end behavior is as , . As , . The graph is decreasing on the interval and increasing on the interval . C. D: , R: ; y-intercept = (0, 0). The graph is symmetric with respect to the y-axis. The graph is continuous everywhere. The end behavior is as , . As , . The graph is decreasing on the interval and increasing on the interval . D. D: , R: ; no intercepts. The graph is symmetric with respect to the y-axis. The graph is continuous everywhere. The end behavior is as , . As , . The graph is decreasing on the interval and increasing on the interval . Example 1
A. D: , R: ; y-intercept = (0, 0). The graph is symmetric with respect to the y-axis. The graph is continuous everywhere. The end behavior is as , and as , . The graph is decreasing on the interval and increasing on the interval . B. D: , R: ; y-intercept = (0, 0). The graph is symmetric with respect to the y-axis. The graph is continuous everywhere. The end behavior is as , . As , . The graph is decreasing on the interval and increasing on the interval . C. D: , R: ; y-intercept = (0, 0). The graph is symmetric with respect to the y-axis. The graph is continuous everywhere. The end behavior is as , . As , . The graph is decreasing on the interval and increasing on the interval . D. D: , R: ; no intercepts. The graph is symmetric with respect to the y-axis. The graph is continuous everywhere. The end behavior is as , . As , . The graph is decreasing on the interval and increasing on the interval . Example 1
Graph Translations A. Use the graph of f(x) = x3 to graph the function g(x) = x3– 2. This function is of the form g(x) = f(x) – 2. So, the graph of g(x) is the graph of f(x) = x3 translated 2 units down, as shown below. Answer: Example 2
Graph Translations A. Use the graph of f(x) = x3 to graph the function g(x) = x3– 2. This function is of the form g(x) = f(x) – 2. So, the graph of g(x) is the graph of f(x) = x3 translated 2 units down, as shown below. Answer: Example 2
Graph Translations B. Use the graph of f(x) = x3 to graph the function g(x) = (x – 1)3. This function is of the form g(x) = f(x – 1) . So, g(x) is the graph of f(x) = x3 translated 1 unit right, as shown below. Answer: Example 2
Graph Translations B. Use the graph of f(x) = x3 to graph the function g(x) = (x – 1)3. This function is of the form g(x) = f(x – 1) . So, g(x) is the graph of f(x) = x3 translated 1 unit right, as shown below. Answer: Example 2
Graph Translations C. Use the graph of f(x) = x3 to graph the function g(x) = (x – 1)3– 2. This function is of the form g(x) = f(x – 1) – 2. So, g(x) is the graph of f(x) = x3 translated 2 units down and 1 unit right, as shown below. Answer: Example 2
Graph Translations C. Use the graph of f(x) = x3 to graph the function g(x) = (x – 1)3– 2. This function is of the form g(x) = f(x – 1) – 2. So, g(x) is the graph of f(x) = x3 translated 2 units down and 1 unit right, as shown below. Answer: Example 2
A. B. C. D. Use the graph of f(x) = x2 to graph the functiong(x) = (x – 2)2– 1. Example 2
A. B. C. D. Use the graph of f(x) = x2 to graph the functiong(x) = (x – 2)2– 1. Example 2
A. Describe how the graphs of and g(x) are related. Then write an equation for g(x). The graph of g(x)is the graph of translated 1 unit up. So, . Write Equations for Transformations Answer: Example 3
A. Describe how the graphs of and g(x) are related. Then write an equation for g(x). The graph of g(x)is the graph of translated 1 unit up. So, . Answer:The graph is translated 1 unit up; Write Equations for Transformations Example 3
B. Describe how the graphs of and g(x) are related. Then write an equation for g(x). The graph of g(x)is the graph of translated 1 unit to the left and reflected in the x-axis. So, . Write Equations for Transformations Example 3
Write Equations for Transformations Answer: Example 3
Answer:The graph is translated 1 unit to the left and reflected in the x-axis; Write Equations for Transformations Example 3
Describe how the graphs of f(x) = x3 and g(x) are related. Then write an equation for g(x). A. The graph is translated 3 units up; g(x) = x3 + 3. B. The graph is translated 3 units down; g(x) = x3 – 3. C. The graph is reflected in the x-axis; g(x) = –x3. D. The graph is translated 3 units down and reflected in the x-axis; g(x) = –x3 – 3. Example 3
Describe how the graphs of f(x) = x3 and g(x) are related. Then write an equation for g(x). A. The graph is translated 3 units up; g(x) = x3 + 3. B. The graph is translated 3 units down; g(x) = x3 – 3. C. The graph is reflected in the x-axis; g(x) = –x3. D. The graph is translated 3 units down and reflected in the x-axis; g(x) = –x3 – 3. Example 3
A. Identify the parent function f(x) of , and describe how the graphs of g(x) and f(x) are related. Then graph f(x) and g(x) on the same axes. The graph of g(x) is the same as the graph of the reciprocal function expanded vertically because and 1 < 3. Describe and Graph Transformations Example 4
Describe and Graph Transformations Answer: Example 4
Answer:; g(x) is represented by the expansion of f(x) vertically by a factor of 3. Describe and Graph Transformations Example 4
Describe and Graph Transformations B. Identify the parent function f(x) of g(x) = –|4x|, and describe how the graphs of g(x) and f(x) are related. Then graph f(x) and g(x) on the same axes. The graph of g(x) is the same as the graph of the absolute value function f(x) = |x| compressed horizontally and then reflected in the x-axis because g(x) = –4(|x|) = –|4x| =–f(4x), and 1 < 4. Example 4
Describe and Graph Transformations Answer: Example 4
Describe and Graph Transformations Answer:f(x) =|x| ; g(x) is represented by the compression of f(x) horizontally by a factor of 4 and reflection in the x-axis. Example 4
Identify the parent function f(x) of g(x) = – (0.5x)3, and describe how the graphs of g(x) and f(x) are related. Then graph f(x) and g(x) on the same axes. Example 4
A. f(x) = x3; g(x) is represented by the expansion of the graph of f(x) horizontally by a factor of . B. f(x) = x3; g(x) is represented by the expansion of the graph of f(x) horizontally by a factor of and reflected in the x-axis. C. f(x) = x3; g(x) is represented by the reflection of the graph of f(x) in the x-axis. D. f(x) = x2; g(x) is represented by the expansion of the graph of f(x) horizontally by a factor of and reflected in the x-axis. Example 4
A. f(x) = x3; g(x) is represented by the expansion of the graph of f(x) horizontally by a factor of . B. f(x) = x3; g(x) is represented by the expansion of the graph of f(x) horizontally by a factor of and reflected in the x-axis. C. f(x) = x3; g(x) is represented by the reflection of the graph of f(x) in the x-axis. D. f(x) = x2; g(x) is represented by the expansion of the graph of f(x) horizontally by a factor of and reflected in the x-axis. Example 4
Graph . On the interval , graph y = |x + 2|. On the interval graph Graph a Piecewise-Defined Function On the interval [0, 2], graph y = |x| – 2. Draw circles at (0, 2) and (2, 2); draw dots at (0, –2) and (2, 0) because f(0) = –2, and f(2) = 0, respectively. Example 5
Graph a Piecewise-Defined Function Answer: Example 5
Graph a Piecewise-Defined Function Answer: Example 5
Graph the function . A. B. C. D. Example 5
Graph the function . A. B. C. D. Example 5
Describe and Graph Transformations A. Use the graph of f(x) = x2– 4x + 3 to graph the function g(x) = |f(x)|. Example 7