Download
1 / 31
330 likes | 559 Views
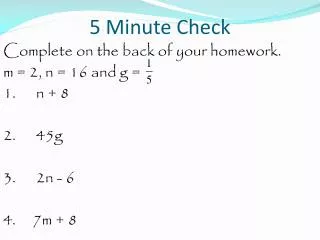
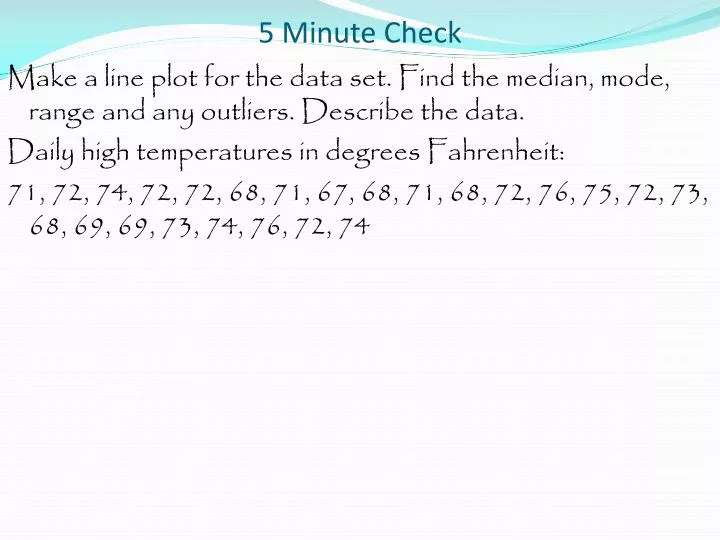
5 Minute Check. Make a line plot for the data set. Find the median, mode, range and any outliers. Describe the data. Daily high temperatures in degrees Fahrenheit: 71, 72, 74, 72, 72, 68, 71, 67, 68, 71, 68, 72, 76, 75, 72, 73, 68, 69, 69, 73, 74, 76, 72, 74. 5 Minute Check.

E N D
5 Minute Check Make a line plot for the data set. Find the median, mode, range and any outliers. Describe the data. Daily high temperatures in degrees Fahrenheit: 71, 72, 74, 72, 72, 68, 71, 67, 68, 71, 68, 72, 76, 75, 72, 73, 68, 69, 69, 73, 74, 76, 72, 74
5 Minute Check Make a line plot for the data set. Find the median, mode, range and any outliers. Describe the data. Daily high temperatures in degrees Fahrenheit: 71, 72, 74, 72, 72, 68, 71, 67, 68, 71, 68, 72, 76, 75, 72, 73, 68, 69, 69, 73, 74, 76, 72, 74 Median: 72˚
5 Minute Check Make a line plot for the data set. Find the median, mode, range and any outliers. Describe the data. Daily high temperatures in degrees Fahrenheit: 71, 72, 74, 72, 72, 68, 71, 67, 68, 71, 68, 72, 76, 75, 72, 73, 68, 69, 69, 73, 74, 76, 72, 74 Median: 72˚ Mode: 72˚
5 Minute Check Make a line plot for the data set. Find the median, mode, range and any outliers. Describe the data. Daily high temperatures in degrees Fahrenheit: 71, 72, 74, 72, 72, 68, 71, 67, 68, 71, 68, 72, 76, 75, 72, 73, 68, 69, 69, 73, 74, 76, 72, 74 Median: 72˚ Mode: 72˚ Range: 9˚
5 Minute Check Make a line plot for the data set. Find the median, mode, range and any outliers. Describe the data. Daily high temperatures in degrees Fahrenheit: 71, 72, 74, 72, 72, 68, 71, 67, 68, 71, 68, 72, 76, 75, 72, 73, 68, 69, 69, 73, 74, 76, 72, 74 Median: 72˚ Mode: 72˚ Range: 9˚ Outliers: none
5 Minute Check Make a line plot for the data set. Find the median, mode, range and any outliers. Describe the data. Daily high temperatures in degrees Fahrenheit: 71, 72, 74, 72, 72, 68, 71, 67, 68, 71, 68, 72, 76, 75, 72, 73, 68, 69, 69, 73, 74, 76, 72, 74 Median: 72˚ Mode: 72˚ Range: 9˚ Outliers: none Describe the data.
5 Minute Check Median: 72˚ Mode: 72˚ Range: 9˚ Outliers: none The number of temperatures is 24. The median means half the temperatures are greater than 72˚ and half are less. More days had a high of 72˚than any other temperature.
Wednesday, March 19 Chapter 12.2a Frequency Tables
Frequency Tables Objective: To construct frequency tables.
Frequency Tables At the end of this lesson you should be able to answer the following question. Can you determine mean, median, or mode from a frequency table?
Frequency Tables A frequency table is a graphical display showing how often a particular event occurred.
Frequency Tables A frequency table is a graphical display showing how often a particular event occurred. The intervals allow you to see the frequency distribution of the data or how many pieces of data are in each interval.
Frequency Tables The list below shows a set of test scores. Make a frequency table to represent the data. How to Construct a Frequency Table. Step 1 – Create a three column table. The 1st column should be titled with the specific variable, the 2nd column – “tally”, and 3rd “frequency”
Frequency Tables The list below shows a set of test scores. Make a frequency table to represent the data. How to Construct a Frequency Table. Step 1 – Create a three column table. The 1st column should be titled with the specific variable, the 2nd column – “tally”, and 3rd “frequency”
Frequency Tables The list below shows a set of test scores. Make a frequency table to represent the data. How to Construct a Frequency Table. Step 2 – Determine the lowest and highest value in the set.
Frequency Tables The list below shows a set of test scores. Make a frequency table to represent the data. How to Construct a Frequency Table. Step 2 – Determine the lowest and highest value in the set. 65 to 98
Frequency Tables The list below shows a set of test scores. Make a frequency table to represent the data. How to Construct a Frequency Table. Step 3 – Define the intervals for the data values. All intervals must be the same.
Frequency Tables The list below shows a set of test scores. Make a frequency table to represent the data. How to Construct a Frequency Table. Step 3 – Define the intervals for the data values. All interval must be the same.
Frequency Tables The list below shows a set of test scores. Make a frequency table to represent the data. How to Construct a Frequency Table. Step 4 – Use tally marks to determine how many values are in each interval.
Frequency Tables The list below shows a set of test scores. Make a frequency table to represent the data. How to Construct a Frequency Table. Step 4 – Use tally marks to determine how many values are in each interval.
Frequency Tables The list below shows a set of test scores. Make a frequency table to represent the data. How to Construct a Frequency Table. Step 5 – Total the tally marks.
Frequency Tables The list below shows a set of test scores. Make a frequency table to represent the data. How to Construct a Frequency Table. Step 5 – Total the tally marks.
Frequency Tables The list below shows a set of test scores. Make a frequency table to represent the data. How to Construct a Frequency Table. Step 6 – Title the table.
Frequency Tables The list below shows a set of test scores. Make a frequency table to represent the data. How to Construct a Frequency Table. Step 6 – Title the table. Test Scores
Frequency Tables The list below shows attendance at state parks. Make a frequency table to represent the data. Do this on your own.
Frequency Tables The list below shows attendance at state parks. Make a frequency table to represent the data.
Frequency Tables The data set below shows the state’s visited by students in Marty’s class. Make a frequency table to represent the data. Do this on your own. 1, 21, 5, 17, 2, 10, 22, 2, 16, 6, 2, 11, 2, 26, 3, 23, 12, 7, 3, 12, 4, 23, 15, 4, 24, 14
Frequency Tables The data set below shows the state’s visited by students in Marty’s class. Make a frequency table to represent the data. 1, 21, 5, 17, 2, 10, 22, 2, 16, 6, 2, 11, 2, 26, 3, 23, 12, 7, 3, 12, 4, 23, 15, 4, 24, 14
Frequency Tables Can you determine mean, median, or mode from a frequency table?
Frequency Tables Agenda Notes Homework– Complete Homework Practice 12-2a Due Thursday, March 20 Mid-Chapter Quiz – Thursday, March 20