Download
1 / 12
120 likes | 324 Views
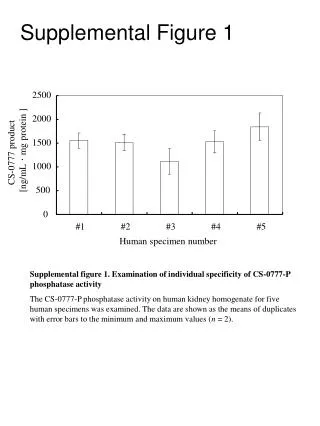
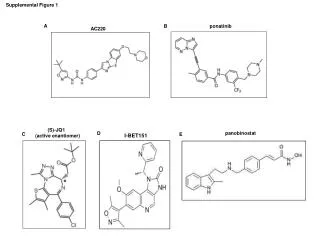
Supplemental Figure 1. A. B. ponatinib. AC220. (S)-JQ1 (active enantiomer). panobinostat. D. C. E. I-BET151. Supplemental Table 1: Clinical presentation and mutational status of the primary AML samples.

E N D
Supplemental Figure 1 A B ponatinib AC220 (S)-JQ1 (active enantiomer) panobinostat D C E I-BET151
Supplemental Table 1: Clinical presentation and mutational status of the primary AML samples Note: The NPM1 status was determined by quantitative PCR utilizing primers for exon 12 of the NPM1 cDNA. The setup for this PCR utilizes a common forward primer and two separate reverse primers, one that anneals and amplifies wild type NPM1 cDNA and the other which anneals to and amplifies the mutant NPM1 cDNA. The positive control for this qPCR is cDNA amplified from OCI-AML3, an AML cell line known to express mutant NPM1. The negative control is cDNA from HL-60 cells which only expresses wild type NPM1. For detection of FLT-ITD, total RNA was isolated and converted to cDNA. Exon 14 of FLT3, the location in which internal tandem duplications are known to occur, was amplified by PCR utilizing primers designed to specifically amplify exon 14 of FLT3. Amplified PCR products were resolved on a 2% agarose gel and documented with a UV transilluminator. Primary AML cells exhibiting amplicons that migrate at greater than 366 base pairs (the size of the wild type FLT3 exon 14) are considered to be positive for FLT3-ITD.
Supplemental Figure 2 MV4-11 C A + 250 nM JQ1, 24 h 0 5 20 0 5 20 nM, AC220, 24 h pFLT3 FLT3 β-actin D MV4-11 + 250 nM JQ1, 24 h 0 5 20 0 5 20 nM, ponatinib, 24 h pFLT3 B FLT3 β-actin F E MV4-11 MV4-11 + 250 nM JQ1, 24 h + 250 nM JQ1, 24 h 0 20 0 20 nM, AC220, 24 h 0 20 0 20 nM, ponatinib, 24 h CL PARP CL PARP 1.0 15.7 17.9 27.8 1.0 13.0 11.4 37.9 β-actin β-actin
Supplemental Figure 2 G MOLM13 + 1000 nM JQ1, 24 h 0 20 0 20 nM, AC220, 24 h c-MYC p21 p27 BIMEL BIML BIMS β-actin
Supplemental Figure 3 C A B D
Supplemental Figure 4 A 1.5 1.5 MV4-11 I-BET151+ ponatinib MOLM13 I-BET151 + ponatinib 1.0 1.0 CI CI 0.5 0.5 0 0 0 0.2 0.4 0.6 0.8 1.0 0 0.2 0.4 0.6 0.8 1.0 Fractional Effect Fractional Effect B
Supplemental Figure 5 A B C 1.5 Primary AML JQ1 + AC220 1.0 CI 0.5 0 0 0.2 0.4 0.6 0.8 1.0 Fractional Effect
Supplemental Figure 6 A Primary FLT3-ITD AML B Primary FLT3-ITD AML + 250 nM JQ1, 24 h + 20 nM AC220 0 5 20 0 5 20 nM, ponatinib, 24 h 0 0.25 1.0 0 0.25 1.0 µM, JQ1, 24 h pFLT3 pFLT3 (Y591) FLT3 FLT3 β-actin β-actin C Primary FLT3-ITD AML + 250 nM JQ1, 24 h 0 20 0 20 nM, ponatinib, 24 h CL PARP β-actin
Supplemental Table 2: Comparison of MOLM13 and MOLM-TKIR response to anti-leukemia agents Note: MOLM13 and MOLM13-TKIR cells were treated with the indicated compounds for 48 hours. The % of annexin V-positive, apoptotic cells was determined by flow cytometry. IC50 values were calculated with GraphPad 5.0. The table shows the IC50 values for AC220, ponatinib, JQ1, PS and vorinostat (VS) in MOLM13 and MOLM13-TKIR cells.
Supplemental Figure 8 A B MOLM13-TKIR * sh-BRD4 sh-NT BRD4 1.0 0.14 HEXIM1 1.0 1.50 β-Actin C
Supplemental Figure 9 1.5 MV4-11-TKIR JQ1 + PS 1.0 CI 0.5 0 0 0.2 0.4 0.6 0.8 1.0 JQ1 PS Fa CI (nM) (nM) 600 6 0.514 0.709 800 8 0.565 0.818 1000 10 0.653 0.809 1200 12 0.667 0.936 1400 14 0.714 0.964 Fractional Effect