Download
1 / 13
130 likes | 251 Views
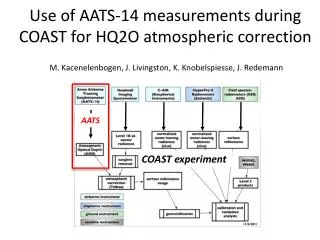
AATS-14 measurements during COAST. J. Livingston R. Johnson M. Kacenelenbogen C. Chang P. Russell. Data acquisition and analysis. 14 data channels centered at wavelengths ( l) 354 – 2139 nm Data sampled at 10 Hz and averaged over 2 sec during flights

E N D
AATS-14 measurements during COAST J. Livingston R. Johnson M. Kacenelenbogen C. Chang P. Russell
Data acquisition and analysis • 14 data channels centered at wavelengths (l) 354 – 2139 nm • Data sampled at 10 Hz and averaged over 2 sec during flights • 2-sec voltage means and stds written to raw data file • September MLO sunrise calibration results used to calculate aerosol optical depth (AOD) at 13 l (using OMI columnar ozone data) and columnar water vapor (CWV) at 941 nm • AODs at 12 l, CWVs, estimated uncertainties archived with a/c latitude, longitude, GPS and P altitudes, static P, and spectral AOD fitting parameters in modified Gaines-Hipskind formatted files for 10/26, 10/27, and 10/28 flights
System performance issues • Tracking changes caused by reflection off wing during aircraft turns • Reflection of the sun off the higher wing occasionally led to a small deviation in AATS-14 tracking that yielded slightly elevated or depressed signals in some science channels. • These reflections occurred when the relative azimuth of the AATS-to-sun vector coincided with the azimuth of the vector defined by the Twin Otter fuselage/higher wing intersection and the higher wing tip. • All affected data have NOT been removed from the archived files. • Computer clock timing uncertainties • Twin Otter computer, AATS can computer, AATS laptop • Anomalously high AODs in 1558-nm channel • These were observed during the MLO calibration and during COAST flights. The source of this problem may have been a light leak in the 1558-nm filter. AODs in this channel have been excluded from the archived files.
System performance issues • Tracking changes caused by reflection off wing during aircraft turns • Reflection of the sun off the higher wing occasionally led to a small deviation in AATS-14 tracking that yielded slightly elevated or depressed signals in some science channels. • These reflections occurred when the relative azimuth of the AATS-to-sun vector coincided with the azimuth of the vector defined by the Twin Otter fuselage/higher wing intersection and the higher wing tip. • All affected data have NOT been removed from the archived files. • Computer clock timing uncertainties • Twin Otter computer, AATS can computer, AATS laptop • Anomalously high AODs in 1558-nm channel • These were observed during the MLO calibration and during COAST flights. The source of this problem may have been a light leak in the 1558-nm filter. AODs in this channel have been excluded from the archived files.
Data Examples 28 Oct
Bottom altitude late early Top altitude
Comparison of AOD spectra on 10/26 and 10/28 Bottom altitude Top altitude late early
26 Oct Columnar water vapor increased with time 28 Oct Columnar water vapor decreased with time