Download
1 / 19
190 likes | 253 Views

E N D
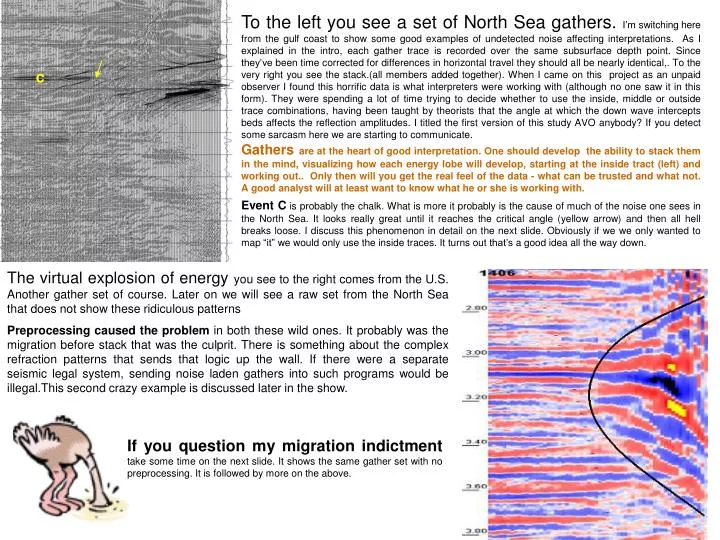
To the left you see a set of North Sea gathers. I’m switching here from the gulf coast to show some good examples of undetected noise affecting interpretations. As I explained in the intro, each gather trace is recorded over the same subsurface depth point. Since they’ve been time corrected for differences in horizontal travel they should all be nearly identical,. To the very right you see the stack.(all members added together). When I came on this project as an unpaid observer I found this horrific data is what interpreters were working with (although no one saw it in this form). They were spending a lot of time trying to decide whether to use the inside, middle or outside trace combinations, having been taught by theorists that the angle at which the down wave intercepts beds affects the reflection amplitudes. I titled the first version of this study AVO anybody? If you detect some sarcasm here we are starting to communicate. c Gathers are at the heart of good interpretation. One should develop the ability to stack them in the mind, visualizing how each energy lobe will develop, starting at the inside tract (left) and working out.. Only then will you get the real feel of the data - what can be trusted and what not. A good analyst will at least want to know what he or she is working with. Event C is probably the chalk. What is more it probably is the cause of much of the noise one sees in the North Sea. It looks really great until it reaches the critical angle (yellow arrow) and then all hell breaks loose. I discuss this phenomenon in detail on the next slide. Obviously if we we only wanted to map “it” we would only use the inside traces. It turns out that’s a good idea all the way down. The virtual explosion of energy you see to the right comes from the U.S. Another gather set of course. Later on we will see a raw set from the North Sea that does not show these ridiculous patterns Preprocessing caused the problem in both these wild ones. It probably was the migration before stack that was the culprit. There is something about the complex refraction patterns that sends that logic up the wall. If there were a separate seismic legal system, sending noise laden gathers into such programs would be illegal.This second crazy example is discussed later in the show. If you question my migration indictment take some time on the next slide. It shows the same gather set with no preprocessing. It is followed by more on the above.
This is a portion of the first raw gather from a pre migration in-line I was able to beg. It is from the same prospect but, as I expected, lacks the energy explosion I have seen on every standard gather This proves the pre-processing (probably the migration) is at fault. How important is that? While process people generally mean well, they sometimes get carried away trying to make the gathers look good. And with all that noise being fed into the gathers the client was still obsessed with AVO. The oval shows where the chalk clones into the horizontally traveling wave guide I mentioned earlier . There is little believable deep continuity, and no strong evidence of multiples,.but for heaven’s sake just look at the noise! I strongly believe the level of resolution improvement I made on the salt project would be probable here, and this could effect the whole North Sea. The next slide goes back to what was used. I’vespent aton of time juststaring at this picture. Each time I come back Isee more crossing patterns. Forexample, look at the events that arecrossing the chalk at the top of the oval.Obviously these are not long multiples bouncing from that really strong interface, and neither are theysimple water bottoms. Going shallower, we see straight linerefractions (at least we can understand them). Now let’s consider the critical angle thing we are seeing inside the oval.Once it is hit, no more energy passes through the chalk, literally making the outside traces useless for deep energy. Furthermore this causes a void in the wave front. As we are taught, nature abhors such things and fills in with whatever it can dreamup. Our simple minded answer is that the energy that is trapped in the horizontal mode is reverberating, becoming a series of point sources. Whether you believe this theory or not, there is noarguing with what we can see physically. Notice that the deep patterns are higher in frequency than thethe believable strong shallow events. This implies they have not traveled very far and that is important.
Old Nsea discussion still holds - 1 • An early wave trap occurrence. Note the expansion ending in some sort of explosion above marker 2; • A trend line to be drawn on the next slide. • The over-corrected leading edge of the wave trap starting at point 4. • Here is where the chalk the cloning begins. The expansion is obvious, but of great interest is the backward dipping event just below. • Once again, these backward sloping events are of great interest. This blast of energy shows the oscillation of the horizontally traveling wave guide, producing point sources of energy that radiate in all directions. The important thing to note is the backward sloping series that is moving towards the inside traces. As I will note below, careful visual analysis finds remnants of this pattern moving inward with time. The void left by the blockage of vertical energy lets these events stand out. • These well defined but weaker emanations are still moving toward the inside. • I have no current explanation of this strong energy, except that it seems obviously connected to the cloning at 4. We have no idea whether the strength is natural, or if it is an interference phenomenon. The possibility of an internal multiple between 1 and 2 is something I study in the removal work. • If you look very closely here, you will see a series of X’s. These define mute points. On the next slide I draw that deep mute in, and discuss the matter. 2 3 4 5 6 7 8 A number of strongly dipping (reverse) events can be seen in the deep section, if you stare at the picture long enough. The system challenge is to separate these obvious noise components from the real reflections. Take some time here. By the way, the trace at the immediate left is the stack. The raw power of the stack to bring out the common denominator continually impresses me. Of course that common property is the correct NMO.
The mute and some results: The yellow line to the left is the deep mute that was used for the results below. The white is a possible upper limit. The red is an interesting trend we don’t yet understand. 1 2 A final result example. 3 4 5 6 7 8
Not perfect, but better - On the left is the client version of a cross line running through the discovery well. On the right is the ADAPS version. Note the change in polarity, and the increased clarity around the well itself. The U1 marker shale is a focal point on the next slide series. On the client version it wanders all the way across the section. Hopefully you will soon see that the faulting shown here is supported by what we see on the in-lines. I ask you to keep their resolution in your mind’s eye as we go to the first of the in-lines I will display. U1
Stop hereand evaluate! On the last slide I asked you to keep the operator’s resolution in your mind. I say here that there should be no question on the green fault (at least) and there was no way to see it before. It was not this apparent on the first glance at my results. When data is broken up by strike slip faults it looks jumbled, and old-fashioned visualizing is needed to establish patterns. Once they become obvious, repetitiveness itself becomes a strong logical proof. This is the first in-lineI show to set the stage. I repeat it in the timed series. But first, notice the marker shale (with stars).Here the continuity is quite obvious. Watch it as we go on, since it tends to prove the fault interpretation. I determined the green fault to be the major one of the system. While there is good cross fault correlation on the ancillary faults, none is evident to me across this main green one. This is strong evidence point to parallel movement. Please notice amplitude standouts enhance by the ADAPS inversion. . As we approach the well you will see there are more attractive spots to drill. Associated with these hydrocarbon clues the important thing is that these smaller faults appear to befactors in the trapping. Next the important series - click through quickly to see how the fault pattern develops. Pay close attention to the marker shale. You will get a chance to come back here to do it again.
. Repeat the timed series by clicking arrow until you get bored by the detail. Else press right arrow to proceed.
I repeat the well with the match. You might notice a better place to drill a pair of faults to the right. . The more I look at it the better it appears to me. Once again the interpretation before ADAPS. And now we go to the other wild example of pre-stack noise.
To the right is my inverted and integrated result on an in-line from the U.S. Below in a gather located by the yellow line. To get these results around 1/2 of the outside traces were thrown out by my optimized stack logic. The need for deep muting came from the same type of critical angle wave trap we saw in the North Sea stuff. The stacked results without the mute were a mess in the target zone.. Amplitude v.s. Offset – We are here to discuss the coherent noise generated by this critical angle crossover.However I can’t resist reminding all thatAVO logic would have accidentally spotted the bright spot because of the impossibly high amplitudes caused by the wave trap. To say their theory had anything to do with what we see here is nonsense. This phenomenon is repeated over and over again in diverse areas, and that probably explains the success rate we hear about. Being a “black box” advocate I can’t knock those results even if they come from ignorance of the facts. However I think the great stratigraphic detail we got with our deep mute beats what they can do. Now, if we had the raw data needed to lift this observed noise off, we might really see some astounding improvement in lithologic resolution (and that would be true in many other areas).
When the downward traveling energy hits the critical angle nothing passes through.This creates a void and nature scrambles to fill it. Every strong event will now emit refractions to help fill that void. Until we line them up in my removal process, they are hard to see. Here we have 5 gather sets ( 25 sets apart).) The arrows point to the probable reservoir we saw on the previous slide.. While this is the strongest other critical angle events can be seen above. Each of these starts as a reflection on the very inside, then clones to wave trap patterns as we move out. Because of the one way travel, the apparent velocity of these extensions is very high, and they get over-corrected. One can see the effect of these anomalies spreading inward with depth.
And we continue – We see that the strength of the noise begins to exceed that of the signal. So I ask you – can you imagine anyone taking amplitude vs. Velocity concepts seriously on this data? I strongly suspect this client was, and I know the North Sea people were. From what we saw on the Gulf Coast removal we can safely say we will see this noise, and if we can see it we can remove it.:
It is our considered opinion that all of the crap shown at the far right is coming from a single wave trap, and we think that trap is generated by sand we pointed to. The end –Hopefully I have left you with a better feel for the stuff you are given to work with. At the same time the concept that much better results are possible might have been planted. Forgive me if I am cynical. Time is passing on and the seismic superstructure is hard to penetrate. Click on this oval to repeat the show. Or on this one to see the Gulf Coast study. Give it plenty of time. Or here for my router.