Download
1 / 18
180 likes | 367 Views
Applying statistical tests to microarray data. Introduction to filtering. Recall- Filtering is the process of deciding which genes in a microarray experiment have significantly varying expression across conditions (and removing from gene expression matrix those that don’t).

E N D
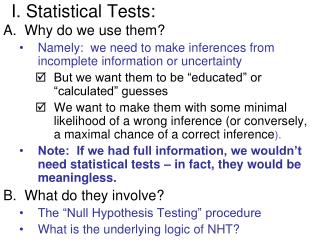
Introduction to filtering • Recall- Filtering is the process of deciding which genes in a microarray experiment have significantly varying expression across conditions (and removing from gene expression matrix those that don’t). • So how do we decide whether a gene varies significantly?: • Hard problem & active area of research (1st use of microarray only in mid-1990s); no fixed protocol for analysis. • Most initial studies simply demanded that intensity ratios should exceed/fall short of a threshold, eg. 2-fold increase or decrease in intensity between two conditions. • More sophisticated approach- apply statistical tests, such as those that we have just discussed.
Approaches to filtering • ‘Old’ approach: if , label the gene x as interesting and keep it (where xCy5 is the background-subtracted intensity of the red dye on the spot corresponding to gene x, xCy3 the same for green and c is a threshold, typically c=1) • here we are comparing 2 samples on the same chip • In the yeast experiments we discussed earlier- genes were identified which had 2-fold increases/ decreases.
Approaches to filtering • ‘Statistical approach’: Perform repeat experiments- eg. 5 target samples obtained from yeast grown under identical conditions and 5 target samples under a different condition and perform eg. T test or ANOVA. • We will go through some concrete examples of application of statistical techniques from last section soon, but first • we motivate this and • discuss some choices that must be made before applying filtering techniques.
Advantages of statistical approach • Performing replicate experiments reduces variability in the summary statistics. • Data from replicate experiments can be analysed using formal statistical methods. • This has the big advantage that you can establish significance of estimates, ie. know how confident you are that genes do not just vary in their intensity values through random effects or inconsistency in the arrays/ dyes, but actually vary in their expression.
Issues in filtering • Preprocessing: Do we use • Logs or not • Ratios or raw intensity measurements • normalized data or not? • Experiment design: Do we want to • compare many samples to a reference and obtain from these expression data which is ratios from that reference or • compare samples of interest directly to each other? • These issues do not appear to be fully resolved in the literature. However we will discuss preprocessing issues after a discussion of how to apply the statistical tests from the last section to filtering microarray data.
Design of experiments • Main issue in design is to decide which samples to compare on the same slide. • Commonly use reference design for multiple slide comparisons • ie. have a target sample which is divided up to be used as “green sample” on all of the arrays.
Tests for differential gene expression in normal/mutant mice • For now, assume that we are going to consider • log2 expression ratios • reference design • So we have a set of values in our gene expression matrix with entries, Mij which correspond to • [See handout]
Normalization & filtering • Normalization: Identify & remove sources of systematic variation in measured intensities other than differential expression, eg. • different labelling efficiencies of dyes • different amounts of RNA in the red and green samples • Necessary for within and between slides comparisons of expression • Filtering is generally to get rid of ‘random’ variation- use repeat experiments to see how much a gene’s expression varies anyway without change in condition.
Self-self hybridization • Need for normalization seen in self-self hybridizations in which the same mRNA sample is labelled red & green:
Ratios/ raw intensities • A reason for using ratios is reverse transcriptional bias- not all mRNAs reverse transcribe with the same efficiency, so it is not possible to directly compare the gene expression of two genes on an array. • Reverse transcriptional bias doesn’t affect comparison of the same gene between chips. • But if we have a sufficiently sophisticated statistical model and we have several arrays with different conditions and several replicates of each experiment (same conditions) then it may be possible to estimate the component of differential intensity due to reverse transcriptional bias and that due to different gene expression- see Kerr et al (homework). • Clearly have more data for estimation if consider red and green measurements separately.
Logs versus straightforward ratios • Whether we want to use log-transformed data to perform our statistical analyses depends on • On how close the intensity values/ log values are to a normal distribution with constant variance for whatever you wish to compare (usually a single gene across conditions) • Whether factors that we wish to eliminate are additive or multiplicative (see Kerr et al- homewk) • It is argued that log-transformed data is closer to normal and that most unwanted factors (eg. dye affinity) have multiplicative effect. • Therefore log data is probably better.
Normalization versus not • Some systematic errors (eg. dye affinity) can be got rid of by normalization. • Essentially it makes sense to do this before filtering for interesting genes, if you cannot do sufficiently many control replicates to estimate those errors directly. • Straightforward normalization saves you from doing extra experiments eg. dye-swap to separate out dye effects from genuine expression ratio changes.
Conclusions • Filtering is the process of deciding which genes are expressed at significantly different levels across the different conditions in your microarray experiment and getting rid of the other genes from your expression matrix before you do other types of analysis (eg. clustering). • Old approach: select by demanding log ratio of intensities exceed threshold. • Statistical approach: use hypothesis tests to determine significant variation.
Conclusions • Can apply T test to work out if the mean of data is same or different between two conditions. • Can apply ANOVA to work out if the mean of data is same or different across two or more conditions. • There are several issues to consider before applying these statistical “filtering” techniques eg. • Should you take logs of data first? • Should you use raw data / ratios? • Should you normalize the data first?
References • Web-based lecture notes by Robert Gentleman, Harvard [http://biosun1.harvard.edu/~rgentlem/Wshop/lect1b.pdf]