Download
1 / 11
110 likes | 241 Views
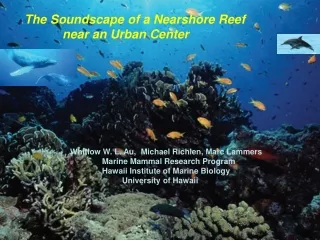
Kilo Nalu Nearshore Reef Observatory Acoustic Monitoring. The Soundscape of a Nearshore Reef near an Urban Center. Whitlow W. L. Au Marine Mammal Research Program Hawaii Institute of Marine Biology University of Hawaii. KILO NALU & MAKAPUU SITES. Makapuu EAR. 22 m depth

E N D
Kilo Nalu Nearshore Reef Observatory Acoustic Monitoring The Soundscape of a Nearshore Reef near an Urban Center Whitlow W. L. Au Marine Mammal Research Program Hawaii Institute of Marine Biology University of Hawaii
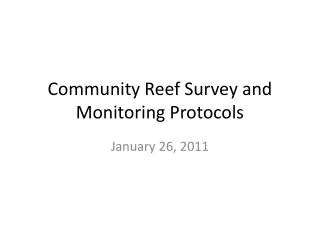
KILO NALU & MAKAPUU SITES Makapuu EAR
22 m depth 690 m off-shore Sample rate = 24,000 Hz = 4.2 Gbytes/day = 124 Gbytes/mn Modified EAR
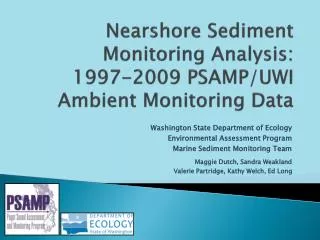
Background • Ecological Acoustic Monitor (EAR) modified and deployed at • Kilo Nalu site – up and running 1st week in Nov, 2008 • Sounds being heard • Boats, boats, boats and more boats. • humpback whales • dolphin echolocation clicks • snapping shrimp • rain
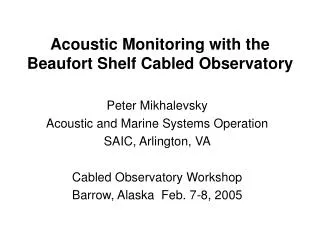
0 1 2 3 4 5 5 Time (min) EXAMPLE OF A BOAT PASSING BY THE KILO NALU SITE 6 K 5K 4 K 3 K Frequency (Hz) 2 K 1K Sound starts
EXAMPLE OF HUMPBACK WHALE SONG AT THE KILO NALU SITE 3 K 2 K Frequency (Hz) 1K 0 0 1 2 3 4 5 Time (min)
3 K 2 K Frequency (Hz) 1K 0 0 1 2 3 4 5 Time (sec) EXAMPLE OF FISH SOUNDS AT THE KILO NALU SITE Frog fish 0 100 ms
EXAMPLE OF RMS SPL IN A DAY: 6 NOVEMBER 6 November 130 Boat 125 120 RMS (db re 1uPa) 115 110 105 Snapping shrimp Snapping shrimp 100 0 1 2 3 4 7 8 9 5 6 12 13 14 16 17 10 15 18 19 20 21 22 23 Hour (HST)
EXAMPLE OF A WEEK RMS SPL: 1-7 NOVEMBER 1-7 November 135 Boat in daylight/ snapping shrimp night 130 125 120 RMS (dB re 1uPa) 115 110 105 100 1 2 3 4 5 6 7 DAY
EXAMPLE OF MIXTURE OF SOUNDS IN WINTER SPL 28 February (Mean SPL = 110.4 dB re1uPa) 28 February Boats & Humpback Whales 130 Hump & shrimp Hump & shrimp 125 120 115 RMS (dB re1uPa) 110 105 0 1 2 3 4 7 8 9 5 6 12 13 14 16 17 10 15 18 19 20 21 22 23 Hour (HST)
POSSIBLE PRODUCTS • Obtaining acoustic signature of small boat • Navy has many signatures of ships – not small boats • Home land security or coastal security issues • Long term – time series of snapping shrimp sounds • biological indicator of negative effects on environment • i.e. EARs data from Kure and Pearl and Hermes show lower • levels for up to a day after a storm. • Behavioral pattern of Humpback whales off Oahu • data for management of HIHWNMS • arrival and departure off Oahu • effects of anthropogenic noise