Download
1 / 28
320 likes | 492 Views
Chapter 2: Satellite Tools for Air Quality Analysis. 10:30 – 11:15. Main Applications of Satellite Tools for Air Quality. Public Health Monitor air quality in areas where there is no ground-based network Advanced warning of major regional events (e.g., fires)

E N D
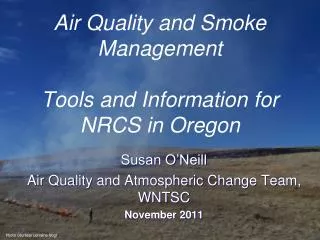
Chapter 2: Satellite Tools for Air Quality Analysis 10:30 – 11:15
Main Applications of Satellite Tools for Air Quality • Public Health • Monitor air quality in areas where there is no ground-based network • Advanced warning of major regional events (e.g., fires) • Information about the transport of pollutants • Outreach and Awareness • Visual appeal: images help communicate air quality information to the public and policymakers • “Blog de Calidad del Aire”
Main Applications of Satellite Tools for Air Quality • Air Quality Event Analysis • Archived images and data aid in retrospective analysis of air quality events • Air Quality Forecasting • Official predictions of the next day’s air quality • Designed to protect public health
Satellite Data Products for Air Quality Analysis • MODIS true color images • MODIS aerosol optical depth (AOD) • GASP (GOES AOD) • OMI sulfur dioxide (SO2) • OMI nitrogen dioxide (NO2) • Hazard Mapping System Fire and Smoke Product
MODerate Resolution Imaging Spectroradiometer (MODIS) • 36 spectral bands ranging from 0.41 to 14.385 mm • Many applications, including air, water, vegetation • Spatial resolution of 1 km, 500 m, and 250 m • MODIS is on NASA’s Terra and Aqua satellites
MODIS True Color Image • A true color image is NOT a picture! • It is made from a combination of the red(band 1), green(band 4), and blue(band 3) bands of MODIS + + =
MODIS True Color Image MODIS TerraJuly 6, 2002 • Smoke • Haze • Clouds • Sunglint • Snow • Clear sky
MODIS True Color Image CLOUDS SMOKE MODIS AquaMarch 18, 2005 SUNGLINT
MODIS Aerosol Optical Depth (AOD) • AOD is a measure of the scattering and absorption of light by particles in a vertical column of the atmosphere • AOD is proportional to particulate concentration • AOD is dimensionless; higher values correspond to high particulate concentrations • Clouds block the measurement of AOD! Sun Particles in atmosphere scatter and absorb light
MODIS Aerosol Optical Depth (AOD) Image Smoke Haze MODIS Terra August 1, 2007
MODIS Aerosol Optical Depth (AOD) Image Smoke MODIS Aqua April 27, 2008 • Red = high particulate concentration • Blue = low particulate concentration
Northern India, Nepal, and BangladeshMODIS True Color and AOD Images Haze Haze MODIS Terra February 5, 2006
GOES Aerosol and Smoke Product (GASP) • GASP is AOD derived from the GOES geostationary satellites • GASP is being developed for Central America and the Caribbean – only experimental images are currently available • Advantage of GASP is that it is available every 30 minutes (high temporal resolution)
Ozone Monitoring Instrument (OMI) • Measures UV and visible radiation backscattered from Earth • Designed to monitor important air quality components including O3, NO2, SO2, and aerosols • Spatial resolution of 13 x 24 km • OMI is on NASA’s Aura satellite
OMI Sulfur Dioxide (SO2) • Used primarily to monitor volcanic eruptions • Measured in Dobson Units (DU) • Vertical column measurement • Clouds block the measurement of OMI SO2! SO2 Popocatepetl 1 DU = 2.687×1016 cm-2
OMI Sulfur Dioxide (SO2) SO2 Columbia SO2 Ecuador Peru 1 DU = 2.687×1016 cm-2
OMI Nitrogen Dioxide (NO2) • Vertical column measurement • Clouds block the measurement of OMI NO2! • Grey areas indicate missing data due to cloud cover NO2
OMI Nitrogen Dioxide (NO2) • New OMI NO2 product: zoom in on Central America and the Caribbean! • Many grey areas due to cloud cover during the rainy season NO2
Hazard Mapping System (HMS)Fire and Smoke Product • Trained analysts use data from GOES, MODIS, and other satellites to map smoke and fire locations • Year-round analysis for USA by NOAA • Analysis for Mexico, Central America, Cuba, and the Bahamas during the fire season (March – June) by Servicio Meteorológico Nacional de México
HMS Fire and Smoke Product • Analysis made 1 pm – 11 pm daily • Red dots are “hotspots” identified by MODIS (fires) • Smoke plumes are grey • Countries outlined in green are the focus of the analysis May 25, 2008
Navy Aerosol Analysis and Prediction System (NAAPS) Global Aerosol Model • NAAPS is a global forecast modelthat predicts the concentrations of sulfate, dust, and smoke aerosols in the troposphere. • NAAPS is run by the U.S. Naval Research Laboratory in Monterey, California. • Meteorological information is provided by the Navy Operational Global Atmospheric Prediction System (NOGAPS) numerical forecast model. • Information on distribution of aerosols is provided by individual sulfate, smoke, and dust emissions models.
Navy Aerosol Analysis and Prediction System (NAAPS) Global Aerosol Model • Model aerosol forecasts are provided: • On a 1°× 1° grid • At 6-hour intervals • Out to 120 hours (5 days) • For more information on the technical aspects of NAAPS, visit http://www.nrlmry.navy.mil/aerosol/index_frame.html. • Model output is a 4-panel graphic available as: • Current day forecast • 5-day forecast • 5-day forecast loop in 6 hour intervals
Interpretation of the NAAPS 4-Panel Graphic • Upper left of panel: Total Optical Depth of sulfate, dust, and smoke aerosols. • Optical depth of aerosols in entire troposphere! • Types of aerosols are color-coded for easy interpretation. • DO NOT focus on this panel, since it is NOT a surface analysis!
Interpretation of the NAAPS 4-Panel Graphic • Upper right of panel: Concentration of Sulfate at the surfacein mg/m3. • Concentration values are color-coded for easy interpretation. • Sulfate aerosols are a main component in urban haze. • DO focus on this panel, because it is a surface analysis!
Interpretation of the NAAPS 4-Panel Graphic • Lower left of panel: Concentration of dust at the surfacein mg/m3. • Concentration values are color-coded for easy interpretation. • Dust can be transported across the Atlantic from Africa and impact the region. • DO focus on this panel, because it is a surface analysis!
Interpretation of the NAAPS 4-Panel Graphic • Lower right of panel: Concentration of smoke at the surfacein mg/m3. • Concentration values are color-coded for easy interpretation. • Smoke is a major issue in the region during the dry season. • DO focus on this panel, because it is a surface analysis!
Activity 2: Air Quality Satellite Products • Participants should break into groups of 3-4. • Each group will be given a packet of satellite images. • For each image, participants should determine: • Satellite and instrument that made the measurement • Pollutant or product represented in the image • Main air quality features (e.g., locations of high concentrations of pollutants • After the team analysis, we will come back together as a large group to discuss the images. • Goal: become familiar with air quality satellite images.