Download
1 / 1
10 likes | 110 Views
A Downburst Study of the 29-30 June 2012 North American Derecho Kenneth L. Pryor NOAA/NESDIS/ STAR Colleen Wilson University of Maryland/Dept. of Atmospheric and Oceanic Science. Introduction

E N D
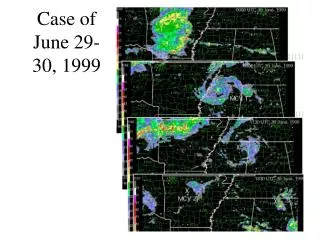
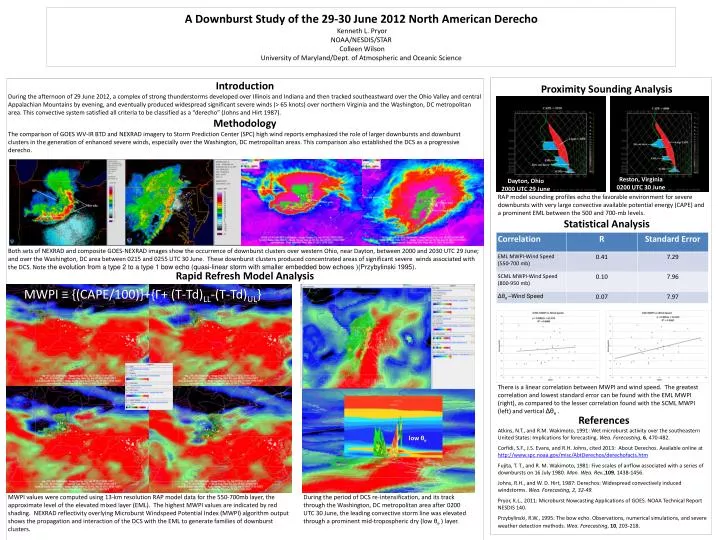
A Downburst Study of the 29-30 June 2012 North American Derecho Kenneth L. Pryor NOAA/NESDIS/STAR Colleen Wilson University of Maryland/Dept. of Atmospheric and Oceanic Science Introduction During the afternoon of 29 June 2012, a complex of strong thunderstorms developed over Illinois and Indiana and then tracked southeastward over the Ohio Valley and central Appalachian Mountains by evening, and eventually produced widespread significant severe winds (> 65 knots) over northern Virginia and the Washington, DC metropolitan area. This convective system satisfied all criteria to be classified as a “derecho” (Johns and Hirt 1987). Methodology The comparison of GOES WV-IR BTD and NEXRAD imagery to Storm Prediction Center (SPC) high wind reports emphasized the role of larger downbursts and downburst clusters in the generation of enhanced severe winds, especially over the Washington, DC metropolitan areas. This comparison also established the DCS as a progressive derecho. Rapid Refresh Model Analysis Proximity Sounding Analysis Dayton, Ohio 2000 UTC 29 June Reston, Virginia 0200 UTC 30 June RAP model sounding profiles echo the favorable environment for severe downbursts with very large convective available potential energy (CAPE) and a prominent EML between the 500 and 700-mb levels. Statistical Analysis Both sets of NEXRAD and composite GOES-NEXRAD images show the occurrence of downburst clusters over western Ohio, near Dayton, between 2000 and 2030 UTC 29 June; and over the Washington, DC area between 0215 and 0255 UTC 30 June. These downburst clusters produced concentrated areas of significant severe winds associated with the DCS. Note the evolution from a type 2 to a type 1 bow echo (quasi-linear storm with smaller embedded bow echoes )(Przybylinski 1995). MWPI ≡ {(CAPE/100)}+{Г+ (T-Td)LL-(T-Td)UL} There is a linear correlation between MWPI and wind speed. The greatest correlation and lowest standard error can be found with the EML MWPI (right), as compared to the lesser correlation found with the SCML MWPI (left) and vertical Δθe . References Atkins, N.T., and R.M. Wakimoto, 1991: Wet microburst activity over the southeastern United States: Implications for forecasting. Wea. Forecasting, 6, 470-482. Corfidi, S.F., J.S. Evans, and R.H. Johns, cited 2013: About Derechos. Available online at http://www.spc.noaa.gov/misc/AbtDerechos/derechofacts.htm Fujita, T. T., and R. M. Wakimoto, 1981: Five scales of airflow associated with a series of downbursts on 16 July 1980. Mon. Wea. Rev.,109, 1438-1456. Johns, R.H., and W. D. Hirt, 1987: Derechos: Widespread convectively induced windstorms. Wea. Forecasting, 2, 32-49. Pryor, K.L., 2011: Microburst Nowcasting Applications of GOES. NOAA Technical Report NESDIS 140. Przybylinski, R.W., 1995: The bow echo. Observations, numerical simulations, and severe weather detection methods. Wea. Forecasting, 10, 203-218. low θe MWPI values were computed using 13-km resolution RAP model data for the 550-700mb layer, the approximate level of the elevated mixed layer (EML). The highest MWPI values are indicated by red shading. NEXRAD reflectivity overlying Microburst Windspeed Potential Index (MWPI) algorithm output shows the propagation and interaction of the DCS with the EML to generate families of downburst clusters. During the period of DCS re-intensification, and its track through the Washington, DC metropolitan area after 0200 UTC 30 June, the leading convective storm line was elevated through a prominent mid-tropospheric dry (low θe ) layer.