Download
1 / 20
200 likes | 306 Views
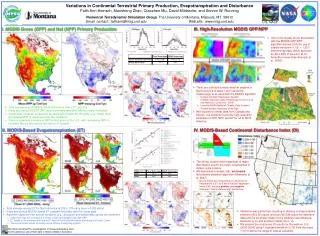
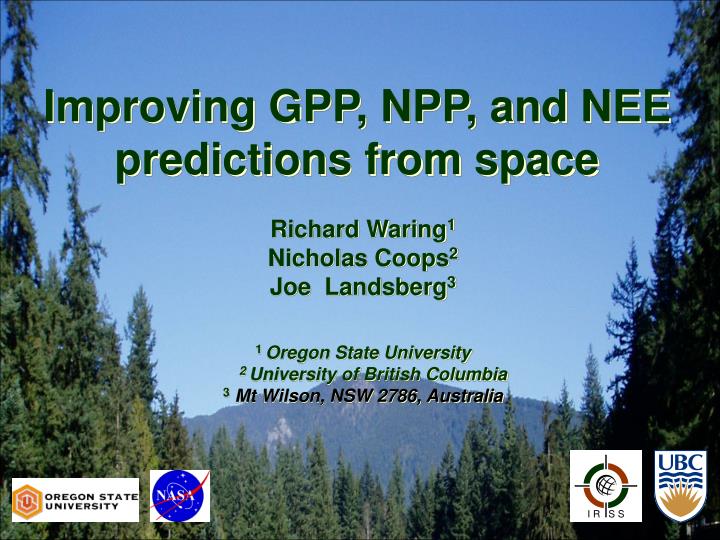
I R S S. Improving GPP, NPP, and NEE predictions from space. Richard Waring 1 Nicholas Coops 2 Joe Landsberg 3 1 Oregon State University 2 University of British Columbia 3 Mt Wilson, NSW 2786, Australia. Eucalyptus plantation GPP =6,000 g C m -2 yr -1. Brazilian rainforest

E N D
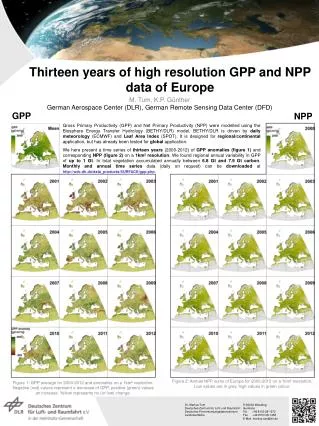
I R S S Improving GPP, NPP, and NEE predictions from space Richard Waring1 Nicholas Coops2 Joe Landsberg3 1 Oregon State University 2 University of British Columbia 3Mt Wilson, NSW 2786, Australia
Eucalyptus plantation GPP =6,000 g C m-2 yr-1 Brazilian rainforest GPP =3,000 g C m-2 yr-1 Photo: Courtesy of Auro Almeida
Brazilian plantation LAI decreases with age as trees approach 40 m in height at 7 years when harvested. Drought reduces LAI more when stand is young than older Drought Drought Auro Almeida, CSIRO Tasmania, unpublished
In the Atlantic Coastal Region of Brazil, native rainforests and eucalyptus plantations use similar amounts of water although LAI differs by > 2 fold. Reason: eucalypts are fertilized & have twice the photosynthetic capacity and twice the max. canopy conductance of the rainforest. Auro Almeida, CSIRO Tasmania, unpublished
Objective: to provide ecological insights to improve predictions of GPP, NPP, and NEE from space • GPP: set limits and identify constraints • NPP: allocation above and below ground • NEE: correlation with GPP
Ecosystem Model Structure Waring, Coops, & Landsberg 2009 For. Ecol & Mgmt (in press)
Leaf chlorophyll conc. linearly related to maximum photosynthetic capacity (link to soil fertility) Zhang et al. 2009. Remote Sen. Env. 113: 880-888. Waring et al. 1995. Plant Cell & Env. 18: 1201-1218.
Leaf conductance (g) and photosynthetic capacity (A) decrease with (relative) tree height & hydraulic conductivity (KL) Ambrose et al. 2009. Plant, Cell & Env. 32: 743-757. Hubbard et al. 2001. Plant, Cell & Env. 24: 113-121.
Stomatal response to vpd varies by an order of magnitude among species in boreal forests Dang et al. 1997. Tree Physiology 17: 521-535.
VPD response is a function of maximum canopy conductance Stomatal sensitivity to vpd is a negative log function (slope =0.6) to maximum conductance at 1 kPa (r2 = 0.75). Oren et al. 1999. Plant, Cell & Env.22:1515-1535.
As the soil water deficit increases beyond a threshold, water loss through transpiration is progressively reduced below its potential as stomata close Eucalyptus maculata Source: Landsberg & Gower 1997. Fig. 4.5. “Application of Physiological Ecology to Forest Management.” Academic Press, San Diego, CA
Root depth determines access to water Eucalyptus marginata 28 m depth that roots penetrate Photo: courtesy of Keith Smettem, University of Western Australia Photo: courtesy of E.D. Schulze
To evaluate soil water limitations, need to assess changes in canopy properties (LAI, fPAR, PRI, & wetness) Canadell et al. 1996. Oecologia 108:583-595
Photosynthetic Reflectance Index(Gamon et al. 1992. Rem. Sen. Env. 41:35-44) 8 species in New Zealand Olive trees Trotter et al. 2002. Int. J. Rem. Sen.23: 1207-1212. Suarez et al. 2009. Rem.Sen. Env. 113:730-744.
Douglas-fir (sunlite) Campbell River, B.C. Hall et al. 2008. Remote Sensing of Env. 112: 3201-3211
Partitioning of forest NPP below ground ranges from 20% to 60% (Waring et al. (1998). When GPP 2500 g C m-2 yr-1(respiration + NPPb) ~ minimum N =38 young ponderosa pine tropical savanna black spruce jack pine old ponderosa pine Litton et al. plantations aspen Litton et al. 2007. Global Change Biology 13: 2080-2109 Chen et al. 2003. Oecologia 137: 405-416 Stape et al. 2008. For. Ecol. & Mgmt. 255: 920-930. Waring et al. 1998. Tree Physiol. 18:129-134.
NEE varies seasonally by type of vegetation, as does GPP After Baldocchi 2009 Aust. J. Bot. (in press)
Predicting Ecosystem Respiration or NEE (GPP-Reco) as a function of eddy-flux measured GPP =0.94 r2 = 0.9 =0.77 After Baldocchi 2009 Aust. J. Bot. (in press)
To improve predictions of GPP, NPP, and NEE from space • Chlorophyll light absorbance is better than nitrogen content to estimate max. conductance and photosynthetic capacity. • Max. conductance and photosynthetic capacity are reduced as trees approach site & species-specific maximum height. • PRI is a good check on modeled constraints on GPP • GPP is more important to estimate accurately than NPP, although NPPA would be helpful to validate model predictions of growth allocation. • Allocation of NPP (& respiration) increases below-ground if water and nutrients are not available, generally not the case if GPP 2500 g C m-2 yr-1. • Ecosystem respiration is ~ 75% of GPP in undisturbed systems, ~ 95% in disturbed systems. Be able to distinguish disturbed systems & recovery.
Email: Richard.Waring@oregonstate.edu Nicholas Coops [nicholas.coops@ubc.ca] Joe Landsberg [jlandsberg@netspeed.com.au] Waring, Coops, & Landsberg. 2009. Improving predictions of forest growth using the 3-PGS model with observations made by remote sensing. For. Ecol. & Mgmt. (in press). (RHW Pub. No. 108). www.fsl.orst.edu/~waring