Download
1 / 1
10 likes | 151 Views
Thirteen years of high resolution GPP and NPP data of Europe. M. Tum, K.P . Günther German Aerospace Center (DLR), German Remote Sensing Data Center (DFD ). GPP. NPP.

E N D
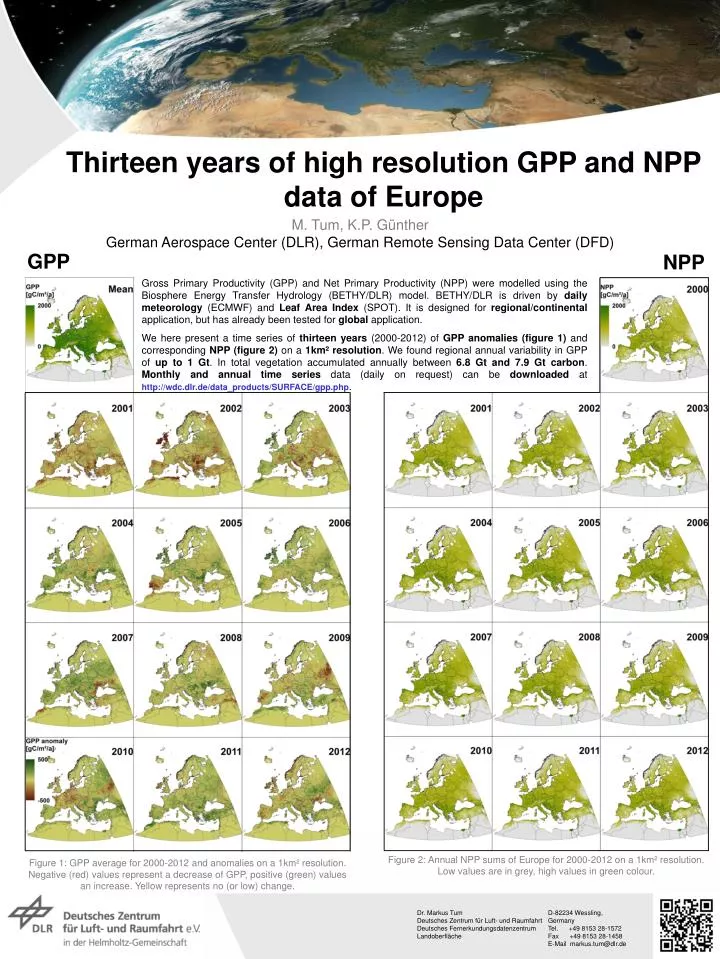
Thirteen years of high resolution GPP and NPP data of Europe M. Tum, K.P. Günther German Aerospace Center (DLR), German Remote Sensing Data Center (DFD) GPP NPP Gross Primary Productivity (GPP) and Net Primary Productivity (NPP) were modelled using the Biosphere Energy Transfer Hydrology (BETHY/DLR) model. BETHY/DLR is driven by daily meteorology (ECMWF) and Leaf Area Index (SPOT). It is designed for regional/continental application, but has already been tested for global application. We here present a time series of thirteen years (2000-2012) of GPP anomalies (figure 1) and corresponding NPP (figure 2) on a 1km² resolution. We found regional annual variability in GPP of up to 1 Gt. In total vegetation accumulated annually between 6.8 Gt and 7.9 Gt carbon. Monthly and annual time series data (daily on request) can be downloaded at http://wdc.dlr.de/data_products/SURFACE/gpp.php. Figure 2: Annual NPP sums of Europe for 2000-2012 on a 1km² resolution. Low values are in grey, high values in green colour. Figure 1: GPP average for 2000-2012 and anomalies on a 1km² resolution. Negative (red) values represent a decrease of GPP, positive (green) values an increase. Yellow represents no (or low) change.