Download
1 / 86
880 likes | 1.03k Views
The Obesity Epidemic: Trends, Causes, Effects and Ways to Reduce the Incidence. Karen Mason, Ph.D., R.D. Western Kentucky University. Obesity Statistics. The number of overweight and obese Americans has continued to increase since 1960

E N D
The Obesity Epidemic: Trends, Causes, Effects and Ways to Reduce the Incidence Karen Mason, Ph.D., R.D. Western Kentucky University
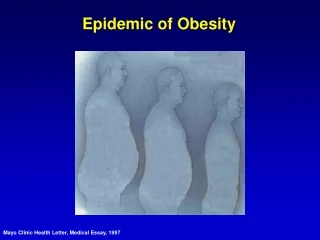
Obesity Statistics • The number of overweight and obese Americans has continued to increase since 1960 • 65.1% of adult Americans are categorized as being overweight or obese(NHANES) • Each year, obesity causes at least 300,000 deaths in the U.S.
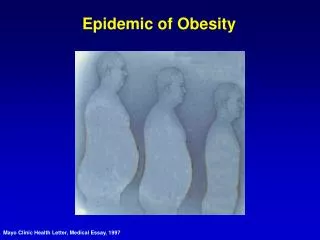
Obesity Trends U.S. Adults U.S. Children/Adolescents Worldwide
Obesity Definitions • Obesity: having a very high amount of body fat in relation to lean body mass, or Body Mass Index (BMI) of 30 or higher. • Overweight: having a BMI of 25-29.9 • Body Mass Index (BMI): • a measure of an adult’s weight in relation to his or her height • the adult’s weight in kilograms divided by the square of his or her height in meters
Obesity Trends Among U.S. Adults between 1985 and 2003 Source of the data: • CDC’s Behavioral Risk Factor Surveillance System (BRFSS) • Collected by state health departments each year • Data collected from a series of monthly telephone interviews with U.S. adults
Overweight in Children and Adolescents • Based on BMI-for-Age Percentiles
Overweight in Children and Adolescents • Based on BMI-for-Age Percentiles • 85th percentile • Overweight (Note: CDC considers “at risk for overweight”) • Equivalent to the adult BMI of 25 • 95th percentile • Obese (Note: CDC considers overweight) • Equivalent to the adult BMI of 30
Trends of overweight children From 1980 to 2002 Overweight children rose from 7% to 15.8% Overweight teenagers tripled from 5% to 16.1% Based on the National Health and Nutrition Examination Survey published in JAMA 291:2847-50, 2004
Comparison of Kentucky’s High School Students to the U.S. Source: Youth Behavioral Risk Surveillance, 2003
Worldwide obesity trends • Obesity is a global problem • Rapid increase in lower- and middle- income developing countries • Increase with the poor Source: Popkin and Gordon-Larsen, 2004
Worldwide obesity statistics • More than 1 billion adults are overweight and at least 300 million of them are clinically obese Source: World Health Organization, 2005
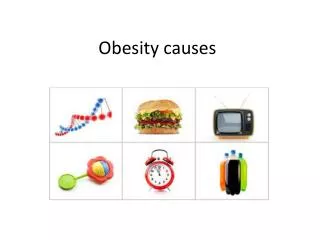
Obesity Etiology Genetics Calorie Consumption Physical inactivity
Obesity Etiology Energy Imbalance: Calories consumed are greater than calories used
Obesity and Genetics • Identical twin studies support that genes influence body weight and body fat. • However, the obesity epidemic cannot be explained by changes in the human genome. • Weight gain results from an interaction between genetics and environment (“obesity-promoting environment”). Source: Loos and Rankinen, 2005
Obesity and Calorie Consumption • Americans spent 46% of their food budget away from home in 2002 and 27% in 1962. (Variyam 2005) • Table-service restaurants now serve from 12-inch plates rather than the standard 10½-in plates
Obesity and Calorie Consumption • Individuals consume more calories when served larger portions. • Americans consume more than 53 teaspoons of added sugars each day (Gardner 2001).
Obesity and Calorie Consumption • From 1971-2000, the average daily caloric intake rose: • for men, 2,450 kcals to 2,618 kcals • for women, 1,542 kcals to 1,877 kcals (http://www.cdc.gov/nchs/) • 62% of Americans are unaware the portion sizes have increased in the last 10-15 years.
Larger Portion Sizes (comparison of portion sizes 15 years ago)
CHEESEBURGER Today 15-20 Years Ago 333 calories How many calories are in today’s cheeseburger?
CHEESEBURGER Today 15-20 Years Ago 333 calories 590 calories Calorie Difference: 257 calories
FRENCH FRIES 15-20 Years Ago Today 210 Calories 2.4 ounces How many calories are in today’s portion of fries?
FRENCH FRIES 15-20 Years Ago Today 210 Calories 2.4 ounces 610 Calories 6.9 ounces Calorie Difference: 400 Calories
SODA 15-20 Years Ago Today 85 Calories 6.5 ounces How many calories are in today’s portion?
SODA 15-20 Years Ago Today 85 Calories 6.5 ounces 250 Calories 20 ounces Calorie Difference: 165 Calories
Would you like a combo meal? • “value meals” and “combo meals” are used for profit by the food companies. • When people are served more food, they eat more food. • For a small price, you get more calories and saturated fat.
Now that’s a value! McDonald’s Quarter 530 calories Pounder w/Cheese 13 g saturated fat Quarter Pounder w/Cheese 1190 calories Extra Value Meal 17 g saturated fat Wendy’s Classic Double 760 calories w/Cheese 19 g saturated fat Classic Double w/Cheese 1360 calories Combo Meal 26 g saturated fat $1.41 $1.57
A better choice at McDonald’s • McGrilled Chicken sandwich 400 calories, 17 g fat, 3 g saturated fat • Side salad 100 calories, 6 g fat, 3 g saturated fat • Low fat Italian salad dressing 50 calories • Water
Statistics of physical inactivity • More than 50% of U.S. adults do not get enough physical activity • More than a third of young people in grades 9–12 do not regularly engage in vigorous physical activity. Daily participation in high school physical education classes dropped from 42% in 1991 to 28% in 2003. Source: CDC, 2005