Download
1 / 9
100 likes | 317 Views
Carbon Dioxide Trends. Climate Change: Connections and Solutions. Inquiry/Critical Thinking Questions. What are some activities that emit carbon dioxide into Earth’s atmosphere? What have been the major trends in atmospheric carbon dioxide levels?

E N D
Carbon Dioxide Trends Climate Change: Connections and Solutions
Inquiry/Critical Thinking Questions • What are some activities that emit carbon dioxide into Earth’s atmosphere? • What have been the major trends in atmospheric carbon dioxide levels? • How is carbon dioxide related to temperatures on Earth? • How can we reduce future carbon dioxide emissions?
Objectives: • Students will: • Identify processes that contribute to carbon dioxide emissions • Graph carbon dioxide emissions • Predict future carbon dioxide trends • Assess the relationship between atmospheric carbon dioxide and global surface temperatures • Brainstorm ways to reduce carbon dioxide emissions
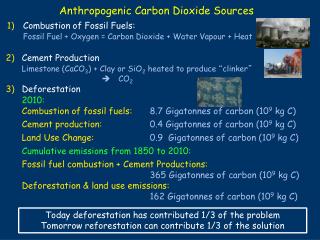
Introduction • Which gases are involved in the greenhouse effect? • Today you will be exploring historical trends in carbon dioxide emissions. Carbon dioxide is an important greenhouse gas that has been linked to many human activities. • Name some activities, human or otherwise, that might add carbon dioxide to our atmosphere.
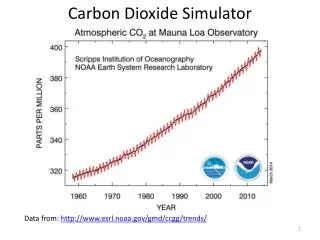
Steps • Work in pairs • 1 sheet of graph paper and 1 CO2 dataset • This dataset from Mauna Loa is the most complete and accurate carbon dioxide dataset in the world. Carbon dioxide is measured in parts per million by volume; 391 parts per million means that for every 1 million molecules in the atmosphere, 391 of those are carbon dioxide molecules.
Steps • Graph the data • Year should be on the x-axis • Carbon dioxide emissions on the y-axis • Predict an average carbon dioxide concentration for the year 2020 and put a star on the graph to represent that number on their graph.
Discussion Questions • What might account for the differences in CO2 concentrations measured in May and October of each year? • How could we take advantage of those natural periods of increased CO2 uptake to reduce overall CO2 in our atmosphere? • Based on the data shown on your graph, what do you think the carbon dioxide concentration will be in the year 2020? • Why do you think carbon dioxide levels have continued to rise during the past 45 years? • What types of activities might raise carbon dioxide levels even faster? • How do you think this will affect Earth’s climate? Predict how your life will be different if this climate change occurs. • What types of actions can we take to lower our carbon dioxide emissions?
Video Global Warming: It’s All About Carbon http://www.npr.org/news/specials/climate/video/
Website Understanding Climate Change: A Primer http://www.whrc.org/resources/primer_home.html