Download
1 / 13
130 likes | 440 Views
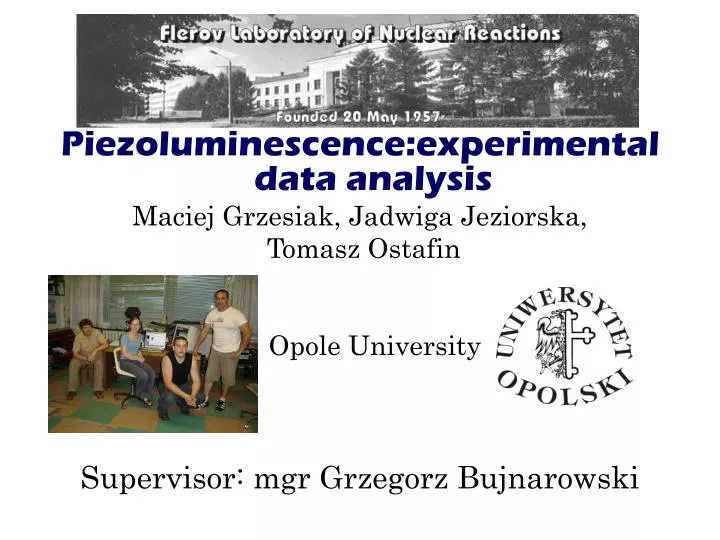
Piezoluminescence:experimental data analysis Maciej Grzesiak, Jadwiga Jeziorska, Tomasz Ostafin Opole University Supervisor: mgr Grzegorz Bujnarowski. Purpose of the exercise.

E N D
Piezoluminescence:experimental data analysis Maciej Grzesiak, Jadwiga Jeziorska, Tomasz Ostafin Opole University Supervisor: mgr Grzegorz Bujnarowski
Purpose of the exercise Analysis of mechanical stresses with method of the spectroscopy in tester of ruby subjected to irradiating with bundle of heavy ions of the radiation in the function of the dose absorbed and in the function of the depth.
Piezoluminescence Changes in the luminescent radiation triggered with mechanical stresses. It manifesting through the appearance in the spectra of additional lines or strips (with additional centres of the luminescence e.g. vacancies ). These stresses influence to existing spectral lines which can cause shift them.
Experiment TimeOfFlight 670 MeV Cyclotron Measuring the profile of the bundle Bombed sample
Spectograph Shamrock SR - 303i. • Experimental parameters of Shamrock SR – 303i • filter – no filter • beam energy – 670 MeV • pattern’s temperature – 77,35 K • angle beetwen pattern and beam - 60 degrees • work temperature of CCD’s camera - - 60 degrees.(C)
FLOW DIAGRAM. CCD camera Grating • Motorised Slits Cover Plates: used to control the effective height of the entrance slit (various sizes available)
A laser beam passes a light source aperture, then is focused by an objective lens into a small focal volume within a fluorescent speciment. A beam splitter separated the light mixture by allowing only the laser light to pass through and reflecting the fluorescent light intothe detection appararus. After passing a aperture the fluorescent light is detected Principle of confocal laser scanning microscope
Curve of the temperature relation for tester of ruby which for calibrating of curves served for two temperatures it is of liquefied nitrogen (77.35 K) and for room temperature (293 K). Spectre of tester of aroused ruby with laser lighting for two exchanged temperatures.
Model spectrum at the temperature of 77,35 degrees (Kelvin). max R2 peak As you can see maxsimum of the R2 peak is about 14460,19 cm-1 , which is correct with results shown for thetemperature’s model spectrum. The graph describing the change of the amplitude and shift spectral lines triggered with rise ofheavy ion’s dose.
R2 peak Model spectrum in the room temperature R2 peak is about 14442,943 cm-1 , which is correct with results shown for thetemperature’s model spectrum. The graph describing the change of the amplitude depending on depth
This graph is presenting a dependence of the tension on an accepted dose of radiation. On this slide we can see a change of putting the maximum of the R2 depending on the depth
Thanks for coordinators of Bogoliubov - Infeld programme,Mr R. Zawodny and Mr W. Chmielowski and for the entire UC board of directors and of course our supervisor Mr. G. Bujnarowski for spending a beatifull moments in Dubna.