Download
1 / 39
390 likes | 398 Views
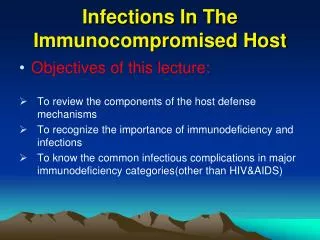
Disease emergence in immunocompromised populations. Jamie Lloyd-Smith Penn State University. Africa: a changing immune landscape. HIV prevalence in adult populations. How might this influence disease emergence?. Heterogeneous immunity and disease emergence.

E N D
Disease emergence inimmunocompromised populations Jamie Lloyd-Smith Penn State University
Africa: a changing immune landscape HIV prevalence in adult populations How might this influence disease emergence?
Heterogeneous immunity and disease emergence In addition to HIV, many other factors affect the host immune response to a given pathogen: Host genetics Nutrition Co-infections Age Immunosuppressive drugs Vaccination and previous exposure Individual-level effects of compromised immunity can include: greater susceptibility to infection higher pathogen loads disseminated infection and death longer duration of infection What are thepopulation-level effectsof immunocompromised groups on pathogen emergence?
Stochastic model for disease invasion into a large population. Modelling pathogen emergence Building on work by Antia et al (2003), Andre & Day (2005), and Yates et al (2006). Linearized birth-and-death process in continuous time. Emergence = introduction + adaptation + invasion A simple model for pathogen invasion Population is structured into groups according to immunocompetence. • Each group has characteristic susceptibility and infectiousness, which can vary independently or co-vary. Pathogen is structured into strains representing stages of adaptation to a novel host species.
Emergence = introduction + adaptation + invasion A simple model for pathogen adaptation Between-host transmission bottleneck causes founder effect Within-host mutation arises during infection and goes to fixation within host Model assumes: Occurs with fixed probability per transmission event. Occurs at a constant rate within each infected host. a probability over an average duration of infection.
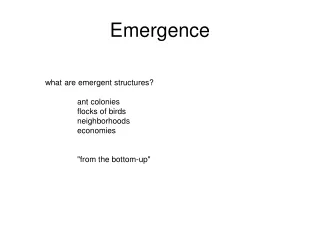
1.5 1.5 1 1 0.5 0.5 0 0 Initial strain Intermediate strain Adapted strain Initial strain Adapted strain Pathogen fitness landscapes adaptation One-step adaptation R0 in healthy population Two-step adaptation adaptation R0 in healthy population
Model assumptions Invasion model (epidemiology) Susceptible pool is large compared to outbreak size. Per capita rates of recovery and transmission are constant. Type of index case is determined by group size weighted by susceptibility: Pr(index case in group i) = (Size of group i) × (Susc. of group i) . Sj (Size of group j) × (Susc. of group j) Adaptation model (evolution) Parameters describing relative susceptibility and infectiousness don’t depend on pathogen strain. Evolutionary and epidemiological parameters are independent of one another.
Model equations: 1 group, 1 strain where, because of the large-population assumption:
Normal I rate I duration b b b t t t 80% healthy 20% immuno- compromised Divide population into two groups, healthy and immunocompromised, which mix at random. Consider different epidemiological effects of immune compromise: NO EFFECT (0), S, I ,I, SI, SI (assume 10-fold changes) Infectiousness can vary via either the rate or duration of transmission.
Covariation of epidemiological parameters When susceptibility and infectiousness co-vary, R0 for the heterogeneous population R0 in a healthy population. R0 = 1 in healthy population
S S 1 0 0.8 S S 0.6 Probability of invasion 0.4 0.2 0 0 2 4 6 R in heterogeneous population 0 Pathogen invasion, without evolution Heterogeneous susceptibility only See Becker & Marschner, 1990. 1 0 0.8 0.6 Probability of invasion 0.4 0.2 0 0 2 4 6 R in healthy population 0
1 1 I 0 0 0.8 0.8 I I 0.6 0.6 I Probability of invasion Probability of invasion 0.4 0.4 0.2 0.2 0 0 0 2 4 6 0 2 4 6 R R in healthy population in heterogeneous population 0 0 Pathogen invasion, without evolution Heterogeneous infectiousness only See Lloyd-Smith et al, 2005.
SI SI SI SI Pathogen invasion: co-varying parameters Solid lines: infectiousness varies in transmission rate 1 1 S , 0 S I 0.8 0.8 0 I 0.6 0.6 Probability of invasion Probability of invasion 0.4 0.4 0.2 0.2 0 0 0 2 4 6 0 2 4 6 R R in healthy population in heterogeneous population 0 0
SI 1 1 S S , 0 I 0.8 0.8 0 SI I SI 0.6 0.6 SI Probability of invasion Probability of invasion 0.4 0.4 0.2 0.2 0 0 0 2 4 6 0 2 4 6 R R in healthy population in heterogeneous population 0 0 Pathogen invasion: co-varying parameters Dashed lines: infectiousness varies in duration
Pathogen invasion: co-varying parameters Population with heterogeneous infectiousness, I Prob. of invasion R0 when cov(inf, susc) = 0
R0 1 0 Initial Adapted 10 0 -1 10 -2 10 -3 Probability of adaptation 10 -4 10 within = between within >> between -5 within << between 10 -6 10 0.5 1 1.5 0 R in healthy population 0 Pathogen evolution: probability of adaptation One-step adaptation 0
0 0 10 10 -1 -1 10 10 -2 -2 10 10 -3 -3 Probability of adaptation Probability of adaptation 10 10 -4 -4 10 10 -5 -5 10 10 -6 -6 10 10 0 0.5 1 1.5 0 0.5 1 1.5 R R in healthy population in heterogeneous population 0 0 Pathogen evolution: probability of adaptation SI S 0 S Assuming P(within) = P(between) = 1×10⁻³ SI I SI 0 SI I Solid lines: infectiousness varies in transmission rate Dashed lines: infectiousness varies in duration
Pathogen evolution: probability of adaptation SI S 0 S 0 0 Assuming P(within) = P(between) = 1×10⁻³ SI 10 10 I SI -1 -1 0 10 10 SI I -2 -2 10 10 -3 -3 Probability of adaptation Probability of adaptation 10 10 -4 -4 10 10 -5 -5 10 10 -6 -6 10 10 0 0.5 1 1.5 0 0.5 1 1.5 R R in healthy population in heterogeneous population 0 0 Solid lines: infectiousness varies in transmission rate
Pathogen evolution: probability of adaptation SI S 0 S 0 0 Assuming P(within) = P(between) = 1×10⁻³ SI 10 10 I -1 -1 SI 0 10 10 SI I -2 -2 10 10 Probability of emergence Probability of emergence -3 -3 10 10 -4 -4 10 10 -5 -5 10 10 -6 -6 10 10 0 0.5 1 1.5 0 0.5 1 1.5 R R in healthy population in heterogeneous population 0 0 Dashed lines: infectiousness varies in duration
Where does adaptation occur? Assuming P(within) = P(between) = 1×10⁻³ 1 SI 0.8 I 0.6 Proportion of evolution within host S , 0 0.4 SI 0.2 0 0 0.2 0.4 0.6 0.8 1 R in heterogeneous population 0 Solid lines: infectiousness varies in transmission rate Dashed lines: infectiousness varies in duration
1 0.8 0.6 Proportion of evolution within host 0.4 0.2 0 0 0.2 0.4 0.6 0.8 1 R in heterogeneous population 0 Where does adaptation occur? Assuming P(within) = P(between) = 1×10⁻³ SI I S , 0 SI Solid lines: infectiousness varies in transmission rate Dashed lines: infectiousness varies in duration
0 0 10 10 -2 -2 10 10 Probability of adaptation Probability of adaptation -4 -4 10 10 -6 -6 10 10 0 0.5 1 1.5 0 0.5 1 1.5 R R in healthy population in heterogeneous population 0 0 adaptation Two-step adaptation Jackpot model R0 in healthy population 1 0 Initial strain Intermediate strain Adapted strain Dashed lines: 1-step adaptation Solid lines: 2-step adaptation
adaptation Two-step adaptation Jackpot model R0 in healthy population 1 0 Initial strain Intermediate strain Adapted strain Fitness valley model R0 in healthy population 1 0 Initial strain Intermediate strain Adapted strain
within << between within >> between Two-step adaptation: crossing valleys R0 1 0 Initial strain Intermediate strain Adapted strain -2 within = between 10 I 0 -4 10 -6 Probability of adaptation 10 -8 10 -10 10 -6 -4 -2 0 10 10 10 10 R of intermediate strain 0
HIV and acute respiratory infections Studies from Chris Hari-Baragwanath Hospital in Soweto. Bacterial respiratory tract infections (Madhi et al, 2000, Clin Inf Dis): Viral respiratory tract infections (Madhi et al, 2000, J. Ped.):
Couch et al, 1997 HIV and acute respiratory infections Alagiriswami & Cheeseman, 2001 Evans et al, 1995
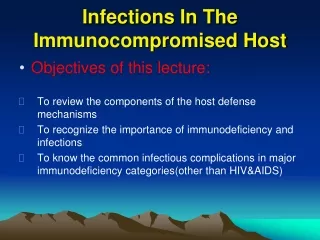
1 20% 10% 10-3 5% 1% 0% Probability of emergence 10-6 R in healthy population HIV prevalence 0 10-9 0 0.5 1 1.5 Illustration: HIV prevalence and influenza emergence Assuming: Susceptibility is 8 higher in HIV+ group, and infections last 3 longer. P(within) = 1×10⁻³ Two-step jackpot adaptation P(between) = 1×10⁻⁶ R0 = 2 for adapted strain
Summary and future directions Invasion • An immunocompromised group can provide a toe-hold for emergence of an unadapted pathogen. • Positive covariance between susceptibility and infectiousness can greatly amplifythis effect. Adaptation • Within-host evolution is crucial at low R0, and when pathogen must cross fitness valleys to adapt. • Prolonged duration of infection has greater influence on emergence than faster rate of transmission. Next steps • Link epi and evolution: incorporate effect of pathogen load? • Data!! On susceptibility and infectiousness as a function of immune status, and on pathogen fitness landscapes. • HIV: more data needed at individual and population levels
Acknowledgements Ideas and insights Bryan Grenfell, Mary Poss, Peter Hudson, and many other colleagues at CIDD (Penn State) Wayne Getz (UC Berkeley) Brian Williams (WHO) Sebastian Schreiber (UC Davis) Funding CIDD Fellowship for research DIMACS and NSF for travel
Pathogen evolution – approximate calculations Can distinguish between mechanisms of evolution by considering the total ‘opportunity’ for each to work. • Total infectious duration = L • Total number of transmission events = B Andre & Day (2005) showed, for a homogeneous population, that P(one-step adaptation) ~ m L + u B This argument can be generalized to the multi-group setting, using the theory of absorbing Markov processes. In addition to the approximate P(adaptation), can derive the approximate proportion of emergence events due to within-host vs between-host adaptation
P(emergence) P(em if index in group 1) P(em if index in group 2) P(index in group 1) Influence of covariation when overall R0 is fixed I Overall R0 = 3 1 0.9 0.8 0.7 0.6 Probability 0.5 0.4 0.3 0.2 0.1 0 -2 -1 0 1 2 10 10 10 10 10 Relative susceptibility of group 2
P(emergence) P(em if index in group 1) P(em if index in group 2) P(index in group 1) Influence of covariation when overall R0 is fixed S Overall R0 = 3 0.8 0.7 0.6 0.5 Probability 0.4 0.3 0.2 0.1 0 -2 -1 0 1 2 10 10 10 10 10 Relative infectiousness of group 2
Present goal: analyze disease emergence in a population with heterogeneous immunocompetence so that parameters may co-vary, with both within- and between-host evolution. Previous work on modelling emergence Antia et al, 2003 (between-host evolution, homogeneous population) • If introduced strain has R0 < 1, ultimate emergence is more likely as R0 approaches 1. Andre & Day, 2005 (within- and between-host, homogeneous pop.) • Duration of infection can be as important as R0. Yates et al, 2006 (between-host only, heterogeneous population without covariation between parameters) • Host heterogeneity in susceptibility or infectiousness alone has little effect on emergence.
But CD4 count isn’t the whole story… HIV’s impact on invasive bacterial infection is thought to be mediated by mononuclear innate immune cells (macrophages, dendritic cells, etc) • Results are indicating that HAART (and resulting elevated CD4 counts) do not reduce risk of bacterial infections. (Noursadeghi et al, Lancet Inf Dis 2006)