Download
1 / 32
340 likes | 488 Views
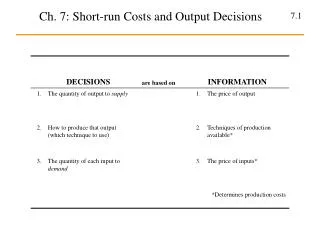
Long-Run Costs and Output Decisions. Short-Run Conditions and Long-Run Directions. In the long-run The firm has no fixed factor of production. Firms are free to enter and exit industries. Normal rate of return is a rate that is just sufficient to keep investors satisfied.

E N D
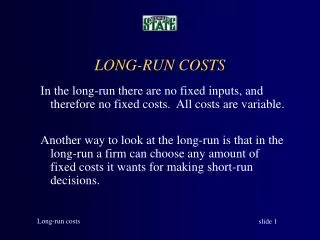
Short-Run Conditionsand Long-Run Directions • In the long-run • The firm has no fixed factor of production. • Firms are free to enter and exit industries. • Normal rateof return is a rate that is just sufficient to keep investors satisfied.
Short-Run Conditionsand Long-Run Directions • For any firm one of three conditions hold at any given moment: • The firm is making positive profits • The firm is suffering losses • The firm is just breaking even. • Breaking even, or earning a zero profitis a situation in which a firm earns exactly a normal rate of return.
Maximizing Profits • Revenue is sufficient to cover both fixed costs of $2,000 and variable costs of $1,600, leaving a positive economic profit of $400 per week.
Firm Earning Positive Profits in the Short Run • To maximize profit, the firm sets the level of output where marginal revenue equals marginal cost.
Firm Earning Positive Profits in the Short Run • Profit is the difference between total revenue and total cost.
Minimizing Losses • There are two types of firms that suffer from losses • Those which shut down immediately and bear losses equal to fixed costs. • Those that continue their operations in the short-run to minimize losses. • The decision to shut down depends on whether revenues from operating are sufficient to cover variable costs.
Minimizing Losses • Operating profit (or loss) or net operating revenue equals total revenue minus total variable cost (TR – TVC). • If revenues exceed variable costs, operating profit is positive and can be used to offset fixed costs and reduce losses, and it will pay the firm to keep operating. • If revenues are smaller than variable costs, the firm suffers operating losses that push total losses above fixed costs. In this case, the firm can minimize its losses by shutting down.
Minimizing Losses • The difference between ATC and AVC equals AFC. Then, AFCq = TFC.
Short-Run Supply Curve of a Perfectly Competitive Firm • The shut-down point is the lowest point on the average variable cost curve. When price falls below the minimum point on AVC, total revenue is insufficient to cover variable costs and the firm will shut down and bear losses equal to fixed costs.
Short-Run Supply Curve of a Perfectly Competitive Firm • The short-run supply curve of a competitive firm is the part of its marginal cost curve that lies above its average variable cost curve.
The Short-Run Industry Supply Curve • The industry supply curve in the short-run is the horizontal sum of the marginal cost curves (above AVC) of all the firms in an industry.
Profits, Losses, and Perfectly Competitive Firm Decisions in the Long and Short Run • In the short-run, firms have to decide how much to produce in the current scale of plant. • In the long-run, firms have to choose among many potential scales of plant.
Long-Run versus Short Run Costs • Short-run cost curves are U-shaped. This follows from fixed factor of production. As output increases beyond a certain point, the fixed factor causes diminishing returns to variable factors and thus increasing marginal cost. • The shape of firm’s long-run average cost curve depends on how costs vary with scale of operation. For some firms, increased scale reduces costs. For others, increased scale leads to inefficiency and waste.
Long-Run Costs: Economies andDiseconomies of Scale • Increasing returns to scale, or economies of scale, refers to an increase in a firm’s scale of production, which leads to lower average costs per unit produced. (Automobile production, a bus carrying 100 people versus 100 people driving 100 cars)
The Long-Run Average Cost Curve • The long-run average cost curve (LRAC) is a graph that shows the different scales on which a firm can choose to operate in the long-run. Each scale of operation defines a different short-run.
A Firm Exhibiting Economies of Scale • The long run average cost curve of a firm exhibiting economies of scale is downward-sloping.
Constant Returns to Scale • Constant returns to scale refers to an increase in a firm’s scale of production, which has no effect on average costs per unit produced.
Decreasing Returns to Scale • Decreasing returns to scale, or diseconomies of scale, refers to an increase in a firm’s scale of production, which leads to higher average costs per unit produced.
A Firm Exhibiting Economiesand Diseconomies of Scale • The LRAC curve of a firm that eventually exhibits diseconomies of scale becomes upward-sloping.
Optimal Scale of Plant • All SRAC curves are U-shaped since there is a fixed scale of plant that constrains production and drives marginal cost as a result of diminishing marginal returns. In the long run scale of plant can be changed and the shape of the LRAC curve depends on how costs vary with scale.
Optimal Scale of Plant • The optimal scale of plant is the scale that minimizes average cost.
Long-Run Adjustmentsto Short-Run Conditions • The industry is not in equilibrium if firms have an incentive to enter or exit in the long run. • Firms expand in the long-run when increasing returns to scale are available.
Short-Run Profits:Expansion to Equilibrium • Firms will continue to expand as long as there are EOS to be realized, and new firms will continue to enter as long as there are positive profits
Short-Run Losses:Contraction to Equilibrium • When firms in an industry suffer losses, there is an incentive for them to exit.
Short-Run Losses:Contraction to Equilibrium • As firms exit, the supply curve shifts from S to S’, driving price up to P*.
Short-Run Losses:Contraction to Equilibrium • The industry eventually returns to long-run equilibrium and losses are eliminated.
Long-Run Competitive Equilibrium • In the long run, equilibrium price (P*) is equal to long-run average cost, short-run marginal cost, and short-run average cost. Profits are driven to zero.
The Long-Run Adjustment Mechanism: Investment Flows Toward Profit Opportunities • The central idea in our discussion of entry, exit, expansion, and contraction is this: • In efficient markets, investment capital flows toward profit opportunities. • Investment—in the form of new firms and expanding old firms—will over time tend to favor those industries in which profits are being made, and over time industries in which firms are suffering losses will gradually contract from disinvestment.