Download

1 / 24
270 likes | 616 Views
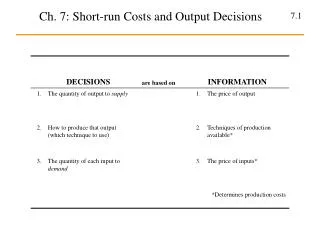
Short-Run Costs and Output Decisions. Decisions Facing Firms. Costs in the Short Run. The short run is a period of time for which two conditions hold: The firm is operating under a fixed scale (fixed factor) of production, and Firms can neither enter nor exit an industry.

E N D
Costs in the Short Run • The short run is a period of time for which two conditions hold: • The firm is operating under a fixed scale (fixed factor) of production, and • Firms can neither enter nor exit an industry. • In the short run, all firms have costs that they must bear regardless of their output. These kinds of costs are called fixed costs.
Costs in the Short Run • Fixed cost is any cost that does not depend on the firm’s level of output. These costs are incurred even if the firm is producing nothing. • Variable cost is a cost that depends on the level of production chosen. Total Cost = Total Fixed + Total Variable Cost Cost
Fixed Costs • Firms have no control over fixed costs in the short run. For this reason, fixed costs are sometimes called sunk costs. • Average fixed cost (AFC) is the total fixed cost (TFC) divided by the number of units of output (q):
Short-Run Fixed Cost (Total and Average) of a Hypothetical Firm • AFC falls as output rises; a phenomenon sometimes called spreading overhead.
Variable Costs • The total variable cost curve is a graph that shows the relationship between total variable cost and the level of a firm’s output. • The total variable cost is derived from production requirements and input prices.
Derivation of Total Variable Cost Schedule from Technology and Factor Prices • The total variable cost curve shows the cost of production using the best available technique at each output level, given current factor prices. $10 $18 $24
Marginal Cost • Marginal cost (MC) is the increase in total cost that results from producing one more unit of output. • Marginal cost reflects changes in variable costs.
Derivation of Marginal Cost fromTotal Variable Cost • Marginal cost measures the additional cost of inputs required to produce each successive unit of output.
The Shape of the Marginal Cost Curve in the Short Run • The fact that in the short run every firm is constrained by some fixed input means that: • The firm faces diminishing returns to variable inputs, and • The firm has limited capacity to produce output. • As a firm approaches that capacity, it becomes increasingly costly to produce successively higher levels of output.
The Shape of the Marginal Cost Curve in the Short Run • Marginal costs ultimately increase with output in the short run.
Graphing Total Variable Costs and Marginal Costs • Total variable costs always increase with output. The marginal cost curve shows how total variable cost changes with single unit increases in total output. • Below 100 units of output, TVC increases at a decreasing rate. Beyond 100 units of output, TVC increases at an increasing rate.
Average Variable Cost • Average variable cost (AVC) is the total variable cost divided by the number of units of output. • Marginal cost is the cost of one additional unit. Average variable cost is the average variable cost per unit of all the units being produced. • Average variable cost follows marginal cost, but lags behind.
Relationship Between Average Variable Cost and Marginal Cost • When marginal cost is below average cost, average cost is declining. • When marginal cost is above average cost, average cost is increasing. • Rising marginal cost intersects average variable cost at the minimum point of AVC. • At 200 units of output, AVC is minimum, and MC = AVC.
Total Costs • Adding TFC to TVC means adding the same amount of total fixed cost to every level of total variable cost. • Thus, the total cost curve has the same shape as the total variable cost curve; it is simply higher by an amount equal to TFC.
Average Total Cost • Average total cost (ATC) is total cost divided by the number of units of output (q). • Because AFC falls with output, an ever-declining amount is added to AVC.
Relationship Between Average Total Cost and Marginal Cost • If marginal cost is below average total cost, average total cost will decline toward marginal cost. • If marginal cost is above average total cost, average total cost will increase. • Marginal cost intersects average total cost and average variable cost curves at their minimum points.
Output Decisions: Revenues, Costs, and Profit Maximization • In the short run, a competitive firm faces a demand curve that is simply a horizontal line at the market equilibrium price.
Total Revenue (TR) andMarginal Revenue (MR) • Total revenue (TR) is the total amount that a firm takes in from the sale of its output. • Marginal revenue (MR) is the additional revenue that a firm takes in when it increases output by one additional unit. • In perfect competition, P = MR.
Comparing Costs and Revenues to Maximize Profit • The profit-maximizing level of output for all firms is the output level where MR = MC. • In perfect competition, MR = P, therefore, the profit-maximizing perfectly competitive firm will produce up to the point where the price of its output is just equal to short-run marginal cost. • The key idea here is that firms will produce as long as marginal revenue exceeds marginal cost.
The Short-Run Supply Curve • At any market price, the marginal cost curve shows the output level that maximizes profit. Thus, the marginal cost curve of a perfectly competitive profit-maximizing firm is the firm’s short-run supply curve.