Download
1 / 32
320 likes | 418 Views
Explore causes, methods, and techniques in system testing process, from function to performance to acceptance testing. Learn about stress tests, reliability, and maintainability metrics.

E N D
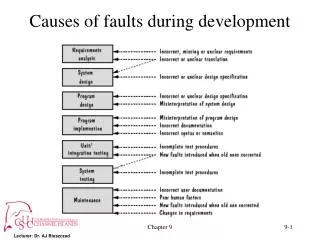
Causes of faults during development Chapter 9
System testing process • Function testing: does the integrated system perform as promised by the requirements specification? • Performance testing: are the non-functional requirements met? • Acceptance testing: is the system what the customer expects? • Installation testing: does the system run at the customer site(s)? Chapter 9
Steps in testing process Chapter 9
Techniques used in system testing • Build or spin plan for gradual testing • Configuration management • versions and releases • production system vs. development system • deltas, separate files and conditional compilation • change control • Regression testing Chapter 9
Test team • Professional testers: organize and run the tests • Analysts: who created requirements • System designers: understand the proposed solution • Configuration management specialists: to help control fixes • Users: to evaluate issues that arise Chapter 9
Function testing • A test should: • have a high probability of detecting faults • use a test team independent of the designers and programmers • know the expected actions and output • test both valid and invalid input • never modify the system to make testing easier • have stopping criteria Chapter 9
Cause-and-effect graphs (1) INPUT: The syntax of the function is LEVEL(A,B) where A is the height in meters of the water behind the dam, and B is the number of centimeters of rain in the last 24-hour period. PROCESSING: The function calculates whether the water level is within a safe range, is too high, or is too low. OUTPUT: The screen shows one of the following messages: 1. “LEVEL = SAFE” when the result is safe or low. 2. “LEVEL = HIGH” when the result is high. 3. “INVALID SYNTAX” depending on the result of the calculation. Chapter 9
Cause-and-effect graphs (2) Causes: Chapter 9
Cause-and-effect graphs (3) Effects: Intermediate nodes: Chapter 9
Notation for cause-and-effect graph Chapter 9
Additional graph notation Chapter 9
Cause-and-effect graph Chapter 9
Test 1 Test 2 Test 3 Test 4 Test 5 Cause 1 I I I S I Cause 2 I I I X S Cause 3 I S S X X Cause 4 S I S X X Cause 5 S S I X X Effect 1 P P A A A Effect 2 A A P A A Effect 3 A A A P P Decision table for cause-and-effect graph Chapter 9
Stress tests Volume tests Configuration tests Compatibility tests Regression tests Security tests Timing tests Environmental tests Quality tests Recovery tests Maintenance tests Documentation tests Human factors (usability) tests Performance tests Chapter 9
Software Reliability, Availability and Maintainability • Reliability • the probability that the system will operate without failure under given conditions for a given time interval • Availability • the probability that a system is operating successfully according to specifications at a given point in time • Maintainability • the probability that, for a given condition of use, a maintenance activity can be carried out within a stated time interval and using stated resources and procedures Chapter 9
3 30 113 81 115 9 2 91 112 15 138 50 77 24 108 88 670 120 26 114 325 55 242 68 422 180 10 1146 600 15 36 4 0 8 227 65 176 58 457 300 97 263 452 255 197 193 6 79 816 1351 148 21 233 134 357 193 236 31 369 748 0 232 330 365 1222 543 10 16 529 379 44 129 810 290 300 529 281 160 828 1011 445 296 1755 1064 1783 860 983 707 33 868 724 2323 2930 1461 843 12 261 1800 865 1435 30 143 108 0 3110 1247 943 700 875 245 729 1897 447 386 446 122 990 948 1082 22 75 482 5509 100 10 1071 371 790 6150 3321 1045 648 5485 1160 1864 4116 Example: Inter-failure times (read left to right, in rows) Chapter 9
Example: Inter-failure graph Chapter 9
Measuring Reliability, Availability and Maintainability • Mean Time to Failure (MTTF) R = MTTF/(1 + MTTF) • Mean Time to Repair (MTTR) M = 1/(1+MTTR) • Mean Time between Failures (MTBF) MTBF = MTTF + MTTR A = MTBF/(1+MTBF) Chapter 9
Reliability function f(t) failure probability density function • from statistics F(t) failure distribution function Chapter 9
Uniform probability density function Chapter 9
3 30 113 81 115 9 2 91 112 15 138 50 77 24 108 88 670 120 26 114 325 55 242 68 422 180 10 1146 600 15 36 4 0 8 227 65 176 58 457 300 97 263 452 255 197 193 6 79 816 1351 148 21 233 134 357 193 236 31 369 748 0 232 330 365 1222 543 10 16 529 379 44 129 810 290 300 529 281 160 828 1011 445 296 1755 1064 1783 860 983 707 33 868 724 2323 2930 1461 843 12 261 1800 865 1435 30 143 108 0 3110 1247 943 700 875 245 729 1897 447 386 446 122 990 948 1082 22 75 482 5509 100 10 1071 371 790 6150 3321 1045 648 5485 1160 1864 4116 Example: Inter-failure times (read left to right, in rows) for reliability prediction Predictions: t4=71.5, because t2=30 and t3=113 t5=97, because t3=113 and t4=81 etc. Chapter 9
Reliability prediction graph Averaging previous two failure times to predict the third. Chapter 9
Acceptance tests • Benchmark test: testing on pre-defined sets of typical (“important”) test cases • Pilot test: install on experimental basis • Alpha test: in-house test • Beta test: customer pilot • Parallel testing: new system operates in parallel with old system Chapter 9
Test documentation • Test plan: describes system and plan for exercising all functions and characteristics • Test specification and evaluation: details each test and defines criteria for evaluating each feature • Test description: test data and procedures for each test • Test analysis report: results of each test Chapter 9
Documents produced during testing Chapter 9
Parts of a test plan Chapter 9
EXAMPLE: Test SORT INPUT DATA: Input data are to be provided by the LIST program. The program generates randomly a list of N words of alphanumeric characters; each word is of length M. The program is invoked by calling RUN LIST(N,M) in your test driver. The output is placed in global data area LISTBUF. The test datasets to be used for this test are as follows: Case 1: Use LIST with N=5, M=5 Case 2: Use LIST with N=10, M=5 Case 3: Use LIST with N=15, M=5 Case 4: Use LIST with N=50, M=10 Case 5: Use LIST with N=100, M=10 Case 6: Use LIST with N=150, M=10 INPUT COMMANDS: The SORT routine is invoked by using the command RUN SORT (INBUF,OUTBUF) or RUN SORT (INBUF) OUTPUT DATA: If two parameters are used, the sorted list is placed in OUTBUF. Otherwise, it is placed in INBUF. SYSTEM MESSAGES: During the sorting process, the following message is displayed: “Sorting ... please wait ...” Upon completion, SORT displays the following message on the screen: “Sorting completed” To halt or terminate the test before the completion message is displayed, press CONTROL-C on the keyboard. Chapter 9
Example: Test script Step N: Press function key 4: Access data file. Step N+1: Screen will ask for the name of the date file. Type ‘sys:test.txt’ Step N+2: Menu will appear, reading * delete file * modify file * rename file Place cursor next to ‘modify file’ and press RETURN key. Step N+3: Screen will ask for record number. Type ‘4017’. Step N+4: Screen will fill with data fields for record 4017: Record number: 4017 X: 0042 Y: 0036 Soil type: clay Percolation: 4 mtrs/hr Vegetation: kudzu Canopy height: 25 mtrs Water table: 12 mtrs Construct: outhouse Maintenance code: 3T/4F/9R Step N+5: Press function key 9: modify Step N+6: Entries on screen will be highlighted. Move cursor to VEGETATION field. Type ‘grass’ over ‘kudzu’ and press RETURN key. Step N+7: Entries on screen will no longer be highlighted. VEGETATION field should now read ‘grass’. Step N+8: Press function key 16: Return to previous screen. Step N+9: Menu will appear, reading * delete file * modify file * rename file To verify that the modification has been recorded, place cursor next to ‘modify file’ and press RETURN key. Step N+10: Screen will ask for record number. Type ‘4017’. Step N+11: Screen will fill with data fields for record 4017: Record number: 4017 X: 0042 Y: 0036 Soil type: clay Percolation: 4 mtrs/hr Vegetation: grass Canopy height: 25 mtrs Water table: 12 mtrs Construct: outhouse Maintenance code: 3T/4F/9R Chapter 9
Problem report forms • Location • Timing • Symptom • End result • Mechanism • Cause Chapter 9
Testing safety-critical systems • Design diversity: use different kinds of designs, designers • Software safety cases: make explicit the ways the software addresses possible problems • failure modes and effects analysis • hazard and operability studies • Cleanroom: certifying software with respect to the specification Chapter 9
Known cause Unknown cause Known effect Description of system behavior Deductive analysis, including fault tree analysis Unknown effect Inductive analysis, including failure Exploratory analysis, including hazard modes and effects analysis and operability studies Perspectives for safety analysis Chapter 9
Cleanroom • The cleanroom approach addresses two fundamental principles: • to certify with respect to the specifications, rather than wait for unit testing to find faults • to produce zero-fault or near-zero-fault software • Blending of numerous techniques Chapter 9