Download
1 / 46
460 likes | 584 Views
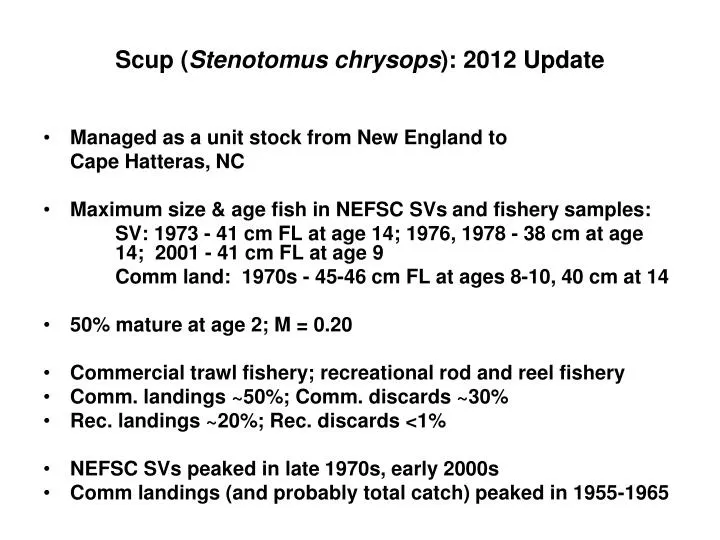
Scup ( Stenotomus chrysops ): 2012 Update. Managed as a unit stock from New England to Cape Hatteras, NC Maximum size & age fish in NEFSC SVs and fishery samples: SV: 1973 - 41 cm FL at age 14; 1976, 1978 - 38 cm at age 14 ; 2001 - 41 cm FL at age 9

E N D
Scup (Stenotomus chrysops): 2012 Update • Managed as a unit stock from New England to Cape Hatteras, NC • Maximum size & age fish in NEFSC SVs and fishery samples: SV: 1973 - 41 cm FL at age 14; 1976, 1978 - 38 cm at age 14; 2001 - 41 cm FL at age 9 Comm land: 1970s - 45-46 cm FL at ages 8-10, 40 cm at 14 • 50% mature at age 2; M = 0.20 • Commercial trawl fishery; recreational rod and reel fishery • Comm. landings ~50%; Comm. discards ~30% • Rec. landings ~20%; Rec. discards <1% • NEFSC SVs peaked in late 1970s, early 2000s • Comm landings (and probably total catch) peaked in 1955-1965
Assessment history Scup (Stenotomus chrysops) • First analytical assessment: 1995 SAW 19 - ADAPT VPA High CVs on estimated Ns; uncertain comm discards (constant ratio for 1984-1988; high variability in rates for 1989-1994) • 1997 SAW 25: “Poor quality of input data” (Discard estimation, landings length sampling); assessment downgraded to “exploratory VPA” to provide general trends • 1998 SAW 27: “Exploratory VPA” and ASPIC production model rejected as basis for management; index approach adopted; NEFSC, MADMF, RIDFW, CTDEP, NJBMF available • NEFSC Spring used for Biomass BRP = SSBMSY Threshold; SAW 19 YPR Fmax = FMSY
Assessment historyScup (Stenotomus chrysops) • 1998 SAW 27: Recommended move to index-based assessment • 1955-1965: Sustainable commercial landings ~20,000 mt – stock at BMSY • Late 1970s: closest NEFSC SV peak – commercial landings at about one-half of 1955-1965 level – stock at one-half BMSY • NEFSC Spring used for Biomass BRP = SSBMSY Threshold = 1977-1979 mean = 2.77 SSB kg/tow; SAW 19 YPR Fmax = FMSY = 0.26 • SAW27 Recommendations adopted in FMP Amendment 12 as basis for BRPs • Amendment 14 formalized proxy BMSY = 2*2.77 = 5.54 SSBkg/tow
Assessment historyScup (Stenotomus chrysops) • 2000 SAW 31: Index-based for biomass (NEFSC Spring SBBkg/tow) and F (catch curves); F => 1.0 for ages 0-3 • 2002 SAW 35: Index-based; Relative Exploitation Index (landings/index) developed to help set quotas; F = unknown • 2003-2008: MAFMC Monitoring Committee updates of NEFSC Spring SSB Index basis for biomass status; No reliable F estimates – use REI to monitor F
Data Poor Stocks Working Group (DPSWG) 2008Scup (Stenotomus chrysops) • ASAP model: sufficient as basis for stock assessment • Non-parametric BRPs: SSB/R, Y/R to get Fmax, F40% (M= 0.20) • R from 1984-2007 (period with fishery and SV age data) • MCMC for year T+1 Ns for AGEPRO • AGEPRO for SSBMSY, 2009 TAC • Considered multiple configurations and model settings to evaluate sensitivity and uncertainty
Data Poor Stocks Working GroupScup (Stenotomus chrysops): December 2008 • Scup not overfished, overfishing not occurring in 2007 • Improved R and low F, SSB increased to 119,000 mt in 2007, F decreased to 0.05 in 2007, relative to: • SSBMSY = SSB40% = 92,044 mt • FMSY = F40% = 0.177 (M = 0.2) • MSY = 16,161 mt total catch; 13,134 mt landings; 3,027 mt discards
Data Poor Stocks Working GroupScup (Stenotomus chrysops): December 2008 • DPSWG 2008 Peer Review Panel Advice: • "...rapid increases in quota to meet the revised MSY would be unwarranted given uncertainties in recruitments. A more gradual increase in quotas is a preferred approach reflective of the uncertainty in the model estimates and stock status.“ • TAC 2009: 7,049 mt = 15.54 mlbs • TAL 2009: 5,071 mt = 11.18 mlbs
Scup (Stenotomus chrysops): 2009 Update • Status for 2008: Not Overfished, Not Overfishing • SSB2008 = 188,000 mt; • F2008 = 0.042 (fully recruited ages 2-7+); • R2008 = 192.4 million age 0 fish • TAC for 2010: 7,752 mt (17.090 mlbs) • TAL for 2010: 6,400 mt (14.110 mlbs) • Increase of 10% over 2009 TAC
Scup (Stenotomus chrysops): 2010 Update • Status for 2009: Not Overfished, Not Overfishing • SSB2009 = 155,000 mt; • F2009 = 0.043 (fully recruited ages 2-7+); • R2009 = 140 million age 0 fish • ACL for 2011: 14,479 mt (31.920 mlbs) • TAL for 2011: 12,020 mt (26.500 mlbs) • Increase of 87% over 2010 TAC
Scup (Stenotomus chrysops): 2011 Update • Status for 2010: Not Overfished, Not Overfishing • SSB2010 = 186,000 mt; • F2010 = 0.040 (fully recruited ages 2-7+); • R2010 = 44 million age 0 fish • ACL for 2012: 18,543 mt (40.881 mlbs) • TAL for 2012: 16,749 mt (36.925 mlbs) • Increase of 163% (2.6 x) over 2009 TAC (ACT)
Scup (Stenotomus chrysops): 2012 Update • Update Landings and Discards through 2011 • Update Survey Indices through 2011 • Age compositions use 2011 ALKs • Retain DPSWG 2008 Assessment ASAP configuration and run model • Update status for 2011 • Assume 2012 TAL (landings quota) is caught • Make projection to determine 2013 OFL
Scup (Stenotomus chrysops): 2012 Update • Status for 2011: Not Overfished; Not Overfishing • SSB2011 = 190,000 mt; • F2011 = 0.034 (fully recruited ages 2-7+); • R2011 = 154 million age 0 fish • Currently no “internal” retrospective patterns
Scup (Stenotomus chrysops): 2012 Update • A between-assessment comparison provides another measure of assessment uncertainty due to “historical retrospective” in model estimates • The 2012 update SSB and F estimates are intermediate with respect to the 2008 DPSWG assessment and 2009 update estimates and close to the 2010-2011 update estimates; • The 2012 recruitment estimates are in general larger compared to the 2011 assessment
Scup (Stenotomus chrysops): 2012 Update • Short term projection for 2013 OFL • Use 2008 DPSWG BRPs (SSBMSY = 92,044 mt; FMSY = 0.177) • AGEPRO stochastic projection • resample 1984-2011 CDF of age 0 recruitment • Note MSY = 13,134 mt of Total Landings + 3,027 mt Total Disc = 16,161 mt of Total Catch • Specify Landings in 2012 = TAL = 16,749 mt; • Median Discards = 3,334 mt; median Total Catch = 20,083 mt • Median F2012 = 0.158, below FMSY • Median SSB2012 = 204,000 mt, above Btarget
Scup (Stenotomus chrysops): 2012 Update • Specify F in 2013 = FSMY = 0.177 Total Catch = 21,680 mt = Overfishing Limit (OFL for 2013) Landings = 17,981 mt and Discards = 3,721 mt (note: independent medians so do not exactly total) Median SSB2013 = 196,000 mt, above Btarget