Download
1 / 15
150 likes | 249 Views
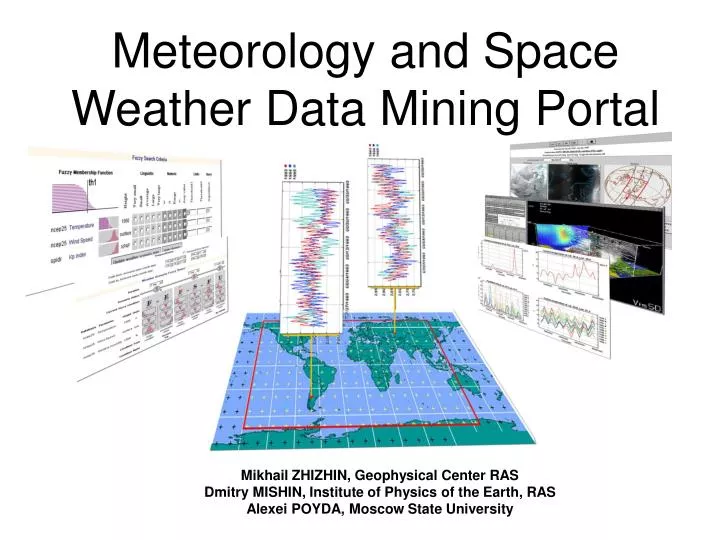
Meteorology and Space Weather Data Mining Portal. Mikhail ZHIZHIN, Geophysical Center RAS Dmitry MISHIN, Institute of Physics of the Earth, RAS Alexei POYDA, Moscow State University. Environmental Scenario Search Engine (ESSE).

E N D
Meteorology and Space Weather Data Mining Portal Mikhail ZHIZHIN, Geophysical Center RAS Dmitry MISHIN, Institute of Physics of the Earth, RAS Alexei POYDA, Moscow State University
Environmental Scenario Search Engine (ESSE) • Portal for interactive searching for events over a Grid of environmental data services hosted by OGSA-DAI • The web services are Grid proxies for the database clusters with terabytes of high-resolution meteorological and space weather reanalysis data over the past 20-50 years • The data mining is based on fuzzy logic to search for events in natural language terms, such as “very cold day” • Parallel data mining across disciplines for correlated events in space, atmosphere and ocean • In cooperation with the National Geophysical Data Center NOAA and supported by the grant from the Microsoft Research Ltd.
Environmental Data Sources Avalanche in the amount of available data: • Monitoring (ground observatories, satellites etc.); • Reanalysis data (models that build regular grids of specific parameters based on available irregular data) Examples: • SPIDR (Space Physics Interactive Data Archive) • From 1930 year • ~120 numerical parameters • ~0.5 TB • NCEP/NCAR Weather Reanalysis Project • From 1950 year • Weather parameters on regular grid • Time resolution 6 hrs • Spatial resolution 2.5 deg • ~1 TB • CLASS (Comprehensive Large Array-data Stewardship System • From 1992 year • Satellite images from ~100 spectral channels • ~1.2 PB, growing ~0.5 PB per year
Environmental Data Models Basic data element is a time series, i.e. an array of values of a parameter at different times at a specific grid point, observatory location, or on specific satellite trajectory These arrays has typical dimension of 106. And basic operations are not joins, but “extracting subrange” or “resampling”
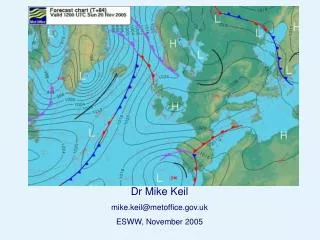
Environmental Data Mining Currently available environmental data mining portals (GCMD, ESG) search metadata and subset the data: • How to find appropriate databases? In addition, ESSE searches for events inside the data: • How to interpret a question of a scientist? • How to build set of database queries that can answer the question? • How to synthesize and present results of a distributed query? Typical ESSE questions: • How often do typical Florida spring storms occur? Have the frequency been increasing in the last 10 years? • Find day-time DMSP satellite images above Florida with spring storms
How to interpret a question of a scientist? • Introduce the notion of an Environmental Scenario (ES) as a basic building block for scientific question • Interpret ES as a fuzzy query expression • Each basic condition in a ES translates into membership function of a fuzzy set, a term in a resulting expression • An expression is built using traditional fuzzy logic operations plus “time shift” operator • Query terms are evaluated at individual data sources • The ESSE engine collects the data and performs fuzzy query operation. The ESSE engine is being built as a Web Service. This enables cascading queries, but raises new research challenges, e.g. optimization of query execution.
Defining fuzzy search criteria Set the fuzzy constraints on the parameters for the event state, for example: (VERY HIGH TEMPERATURE) and (VERY HIGH HUMIDITY)
Working with Environmental Scenarios The user may search for a desired scenario by describing several subsequent events. Scenario example: (HEAVY RAIN) followed by (VERY LOW TEMPERATURE)
How to synthesize and present results of a distributed query? • Environmental Scenario search result is a scored list of candidate events. “Score” represents the “likeliness” of each event in a numerical form • The result page provides links to visualization and data export pages • Each event can be viewed as • time series • dynamic 5D volume • satellite images animation • Data subset for each event can be exported in XML and NetCDF formats
Scenario search results: scored event list • “Score” represents the “likeliness” of each event in a numerical form. • The results page provides links to visualization and data export pages.
Viewing the event in time and space Vis5D time-space-parameter animation
Online demo scenario • User login on ESSE portal • Search for a database with “cloud cover” parameter and coverage around Moscow • Select the database “NCEP Reanalysis”, the location “Moscow”, and the parameter “Cloud cover” • Compose the event scenario “Low cloud cover” • Search for day events in the summer 2005 • Show the most likely event found with time series and satellite images