Download
1 / 19
200 likes | 300 Views
SUSSIX: A Computer Code for Frequency Analysis of Non-Linear Betatron Motion F. Schmidt R. Bartolini H. Renshall G. Vanbavinckhove E. Maclean (presenting). Outline. What is SUSSIX? How is SUSSIX used? How does SUSSIX work? How effective is SUSSIX? Speeding up SUSSIX... Conclusion.

E N D
SUSSIX: A Computer Code for Frequency Analysis of Non-Linear Betatron Motion F. Schmidt R. Bartolini H. Renshall G. Vanbavinckhove E. Maclean (presenting)
Outline What is SUSSIX? How is SUSSIX used? How does SUSSIX work? How effective is SUSSIX? Speeding up SUSSIX... Conclusion
What is SUSSIX? • SUSSIX : a program for post processing of turn-by-turn betatron oscillation data written by F. Schmidt & R. Bartolini. • Computes the frequency decomposition of the signal using an interpolated FFT with time filter to determine the tune to high precision. • Calculates dynamical quantities: Resonance driving terms, • Detuning, • Smear… • Data: Computed from particle tracking • Measured from BPMs • http://www.cern.ch/emaclean/ source files • example • documentation
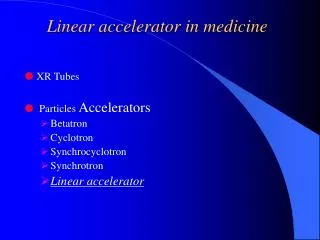
FFT / SUSSIX The amplitude spectrum of the turn-by-turn data Tracking data signal Px (rad) x Frequency (tune units) Px (rad) x Frequency (tune units) Tracking data in the x plane for Diamond light source. From R.Bartolini, ICAP 2006, Chamonix, 02 October 2006
Data is output from SUSSIX to “lines” file Data output for each plane considered For each BPM file studied ANALYSIS OF X SIGNAL, CASE: 1 TUNE X = 0.280005910458087 Line Frequency Amplitude Phase Error mx my ms p 1 0.2800059104581E+00 0.622905178776E-01 0.380122180962E-01 0.00000000000E+00 1 0 0 0 2 0.4399884392791E+00 0.989214203213E-04 -.391350614723E+02 0.26019532406E-06 -2 0 0 -1 3 -.4399870444290E+00 0.708127509993E-04 -.210210002990E+02 0.11346548138E-05 2 0 0 1 4 0.4244673396355E-05 0.571770494641E-04 0.636737742552E+02 0.42446733964E-05 0 0 0 0 5 0.4100132929610E+00 0.408801734260E-04 0.258199339300E+02 0.11735779843E-04 -1 -1 0 -1 6 0.3800158793311E+00 0.450761326468E-04 0.422299367249E+02 0.94405265322E-06 0 -2 0 -1 7 -.3800181350819E+00 0.449392480866E-04 -.108056969751E+03 0.31998034197E-05 0 2 0 1 8 0.2998237923637E-01 0.181993216160E-04 -.990361266979E+02 0.42426663168E-05 -1 1 0 0 9 -.4100020901909E+00 0.145698681839E-04 0.614182554491E+02 0.53300974268E-06 1 1 0 1 10 0.3099896694036E+00 0.157916924317E-04 -.416195601121E+02 0.28629571418E-05 0 1 0 0 The frequency (in tune units), amplitude and phase of the spectral lines are output • If requested additional output given: • “reson#” • “smear#” • “invar#” • “conju#” The spectral lines are ordered in decreasing amplitude Spectral lines are matched to the closest frequency resonant driving term and errors given Tunes are also specified separately
Using SUSSIX • Data sources: SIXTRACK binary file “fort.90” • ASCII file “bpm.0001” • two columns per plane of motion: x, px, y, py, σ, pσ • sussix.inp file specifies the SUSSIX actions. • Details of the flags may be found in the SUSSIX documentation. • sussixsystem dependant executable
Using SUSSIX Sussix.inp : C C INPUT FOR SUSSIX_V4 ---17/09/1997--- C DETAILS ARE IN THE MAIN PROGRAM SUSSIX_V4.F C ISIX = 0 NTOT = 1 IANA = 2 ICONV = 1 TURNS = 1 1000 NARM = 20 ISTUN = 0 TUNES = 0.29 .235 .07 NSUS = 0 IDAM = 2 NTWIX = 1 IR = 1 IMETH = 1 NRC = 3 EPS = .2000D-2 NLINE = 4 L,M,K = 1 0 0 = -2 0 0 = 2 0 0 = 0 1 0 IDAMX = 1 NFIN = 40 ISME = 1 IUSME = 20 INV = 1 IINV = 25 ICF = 1 IICF = 35 Data type ASCII or binary • Analysis type: • (0) = postprocessing of previous output • = full data analysis • = also output the FFT Number of files to analyse Specifies the initial and final turn number over which the data will be analysed. • Selects method for determining tunes. • (0) take highest amplitude spectral line • Take spectral lines lying inside a certain frequency range • Enforce selected tunes Specifies whether the signal z(n)=x(n)-ipx(n) is real or complex. Without momentum information the FT of Z at negative values is just the complex conjugate of positive frequency spectrum. Consider frequencies like +2Qx and -2Qx, which are generated by different resonances and would have different amplitudes given the full signal. Without the momentum information the information on the two lines gets mixed up and they will have the same amplitude Turns on or off the time window filter Outputs specific spectral lines to a separate file: reson#
How does SUSSIX work? • SUSSIX performs a frequency analysis on the provided turn-by-turn data. The time signal with the turn-by-turn data is decomposed into a series of spectral lines. • The turn by turn data signal {z(1),z(2)...z(N)} is decomposed as a quasi-periodic signal: • Turn by turn data signal is analysed to give the Amplitude spectrum: • Line with the largest amplitude is in most cases the fundamental frequency (tune). • this can be overridden using the ISTUNE in the sussix.inp file • Regular motion means other frequencies are linear combinations of the fundamental tunes:
How does SUSSIX work? • At the core of SUSSIX is a Fortran Routine TUNENEWT,developed by the Bologna Group in the mid-nineties (Author: A. Bazzani ; tests by R. Bartolini, M. Giovannozzi, & E. Todesco). • TUNENEWT determines the maximum of the amplitude of the FFT. • SUSSIX uses TUNENEWT to analyse the full frequency spectrum: • The fundamental frequencies are found using TUNENEWT: • Frequency ( k), Amplitude (ak), Phase (k) • Harmonic time series built: • & subtracted from the original signal • New signal z(n) – zk(n) is re-analysed with tunenewt... • The spectral lines are ordered, as linear combinations of the tunes, in decreasing amplitude.
How effective is SUSSIX? Use of time window filters improves the effectiveness of the determination of tunes / principal with TUNENEWT. In SUSSIX a Hanning filter may be applied by selecting the IMETH 1flag in sussix.inp Applying the filter broadens the main peak FWHM from 2/N to 4/N reduces the height of side lobes by a factor 1/N2
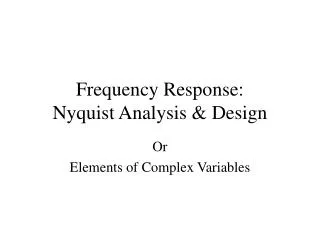
Numerical precision of the TUNENEWT algorithm for finding principal frequencies FFT scales as 1/N No time filter Interpolated FFT scales as 1/N2 Hanning filter Interpolated FFT scales as 1/N4 from R. Bartolini et al. Part. Acc., 52, 147, (1996)
However the reconstruction of the amplitude and phase of the Fourier coefficient is slightly less precise than for frequency... Phase error 1/N3 Amplitude error 1/N3 Frequency error 1/N4 Courtesy R. Bartolini
The 1/N4 scaling of errors in the interpolated FFT with Hanning filter does not hold when the signal is noisy… With Noise: 1/N1.5 – 1/N2 BUT STILL BETTER THAN FFT WITHOUT NOISE No noise: 1/N4 from R. Bartolini et al. Part. Acc., 55, 1, (1996)
Further limits: • Due to the finite time signal the spectral lines have finite FWHM 4/N (with Hanning filter) • To resolve the spectral lines they must be separated by at least the FWHM • If a spectral line lies within a FWHM SUSSIX will loop around the correct frequency without properly subtracting the two contributions. • Observe a cluster of lines about the correct frequency. • Increasing N will allow closer spectral lines to be distinguished… • The signal is decomposed as a quasi-periodic time series: • Implies a regular stable orbit • In highly chaotic regime or close to resonances cannot produce meaningful results
Further limits: In applications to BPM data SUSSIX is limited by the decoherence of the turn-by-turn oscillations. The centroid of the beam is measured in the BPMs. If particles are oscillating with different frequencies (decoherence) then motion of the centroid is damped. Signal quality is reduced and hence it becomes more difficult to identify the resonant driving terms
SUSSIX is still better than an FFT Frequency Map analysis is a powerful method of extracting information on the Beam Dynamics. Method relies on being able to very accurately determine the tune. TUNENEWT provides the level of precision necessary for these studies. Measured data Modeled data Diamond Frequency Maps Courtesy R. Bartolini
Improving the SUSSIX runtime: parallelization of the BPMs • SUSSIX represents a bottleneck in the control room. • For a single off momentum measurement, the beta-beat group would be required to analyze 15 sets of ~500bpm signals. >15minutes spent running sussix per measurement. • Two approaches to speeding up the running of SUSSIX have been attempted: • Parallelization of the FFT using recently released NAG parallel FFT routines • overheads involved in setting up the parallelization cancelled out the benefits of the parallel FFT • Parallelization of the analysis of multiple BPMs • At present SUSSIX performs the analysis of each set of BPM data in series. • Parallelizing the BPM analysis has produced a substantial improvement in the run time of SUSSIX when analysing a large number of BPMs • Harry Renshallwho has been working on the parallelization of SUSSIX will talk further on this topic.
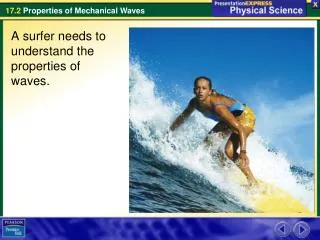
Time for sussix to run on dedicated 24 core spareb7. Input data was 1000 bpm dual plane files. Analysis over 1900 turns. Time (s) Cores
Conclusion • SUSSIX calculates dynamical quantities (tune, resonance driving terms…) from turn-by-turn betatron oscillation data. • The code is well tested on both tracking and experimental data. • SUSSIX uses the TUNENEWT routine to find the fundamental frequencies of the signal. The corresponding harmonic is subtracted and the new signal re-analyzed. • SUSSIX uses an in interpolated FFT with a Hanning filter to obtain the amplitude spectrum. This substantially improves the precision of determination of fundamental frequencies, allowing application to Frequency Map Analysis. • The precision of sussix is limited by noise, decoherence of the beam, and the chaotic regime. Spectral lines within 4/N may not be resolved. • Recent progress has been made in speeding up the operation of SUSSIX, Harry Renshall will discuss further. • SUSSIX is looking forwards to use in several MDs through the 2011/12 period